- Joined
- Jan 23, 2020
- Messages
- 4,336
- Likes
- 6,705
For a tweeter, does diamond have real advantages over beryllium? I know it's stiffer, but it's also heavier. What situations would you want to go with a diamond tweeter over a beryllium tweeter?

Diamonds are forever.For a tweeter, does diamond have real advantages over beryllium? I know it's stiffer, but it's also heavier. What situations would you want to go with a diamond tweeter over a beryllium tweeter?
And diamonds are a audiophile's best friend.Diamonds are forever.

That's right. So, in contrast to the comment by @mt42, that is fully sufficient for their purpose. They don't need the math to maximize the performance of their application because the tools they have are sufficient.Because the F1 drivers exceptional understanding is subjective based on how they feel in the motorcar as it navigates the course.
It helps to look at the ripples on the top of an FR plot, both on-axis, and off-axis. If they are "broadly speaking" periodic, and say, the period is 200Hz, the loudspeaker is a bookshelf, then these ripples are more likely an artifact of measurement, and they point out that there is a secondary path or audio propagation which is ~1.6m longer than the direct path. For 1dB ripple, the secondary path is about -20dB re direct.Indeed, ground plane measurements can be very accurate (for the bass), more accurate than an anechoic chamber. Hartman even uses them for that purpose. Judging by Erin’s ground plane measurement pictures, he definitely has at least 15m+(likely much more) on all sides.
Hopefully Erin ends up an 801D4 to measure, so we can see exactly how accurate the spec is.
The measurements of the 800D3 were performed in an anechoic chamber whose measurement limit is 100Hz. For the frequency range below 100Hz, near-field measurements were performed and then automatically combined with the far-field measurement in the software.My 2c: The LF FR response above is, obviously, from a truncated IR, measured by the "semi-anechoic" technique. You may ask why "obviously"? Sorry, I am not capable of explaining that to non-PhDs in a forum post.
No it doesn't. If used correctly, this also works with the Klippel NFS or with a ground plane measurement (the nearest boundary surfaces only have to be appropriately distant) and even the combination of far-field and near-field measurement is able to achieve satisfactory results if performed correctly.Generally, measuring such low-frequency as 20Hz requires open-field conditions in a sphere of > 15m diameter.

If it's that easy, let's just do it. Let's see how close a 801D4 clone will get us to the f3 of 15Hz at [email protected] in free field (anechoic). One never believes me here without all-embracing proofThe suitable drivers are not uncommon, see https://www.focal-america.com/wp-content/uploads/2014/02/FT_access_25A4.pdf Put it in a 100+L vented box with a port tuned, say, at 20Hz, and voila!
).


The measurements of the 800D3 were performed in an anechoic chamber whose measurement limit is 100Hz. For the frequency range below 100Hz, near-field measurements were performed and then automatically combined with the far-field measurement in the software.
So, no truncated In-room measurement.
But it is clear, errors can occur when combining near and far field measurements - e.g. mixing up measurements.
No it doesn't. If used correctly, this also works with the Klippel NFS or with a ground plane measurement (the nearest boundary surfaces only have to be appropriately distant) and even the combination of far-field and near-field measurement is able to achieve satisfactory results if performed correctly.
As an example, here is a simple simulation of a 15'' subwoofer in a closed 140L cabinet in VCAD and in comparison the real measured combined near field and far field measurement of the finished loudspeaker (both with baffle step correction).
Above 100Hz the 15'' subwoofer no longer behaves ideally, hence the deviation from the simulation. But below 100Hz the combined nearfield-farfield measurement agrees very well with the simulation (below 20Hz my measurement microphone is no longer calibrated).
As you can see, it works without PhD and 15m tower.
View attachment 154805
If it's that easy, let's just do it. Let's see how close a 801D4 clone will get us to the f3 of 15Hz at [email protected] in free field (anechoic). One never believes me here without all-embracing proof
First, we simulate the two subwoofers in half space (2pi) with 100L + 100L volume and a BR port tuning of 20Hz - as specified by @mt42. With a series resistor of 0.5 Ohm (representing the resistances of cable and crossover) the drivers in parallel configuration reach a minimum of 2.5 Ohm.
View attachment 154816
In half-space we reach the targeted [email protected].
f3 = 18Hz and a f6 = 16Hz. If we could stop here, the specification of the 801D4 (800D3) would be pretty well met. Unfortunately, if we don't want to use the 801D4 as wall in speakers, we'll have to move on.
Now we still have to take into account the transition into the full space (into the free field). So now comes the baffle step correction based on the speaker baffle size.
View attachment 154839
At first glance, this looks worse than it is. The blue curve shows the ideal expected frequency response of the driver without crossover in the loudspeaker cabinet in free field.
When the filter slope of the woofer is formed in the crossover, the capacitive part of the driver impedance forms a resonant circuit together with the series-connected coil, which leads to the formation of a hump in the frequency response around the center frequency of the resonant circuit.
People with a PhD in electrical engineering can explain this more precisely
I have drawn this roughly as an orange curve. The hump can also be more pronounced - this is only an estimate by me.
View attachment 154850
In yellow I have drawn the sound pressure at 15Hz. This is with ideal drivers and the TSP data of the Focal 25A4 subwoofer just 78dB at 2.83V.
If the rest of the speaker really plays with [email protected], then f12 = 15Hz and not f3 as stated in the specification - voila! The laws of physics still apply.
Our 801D4 copy would have an f6 of 25Hz at 90dB sensitivity. The value for f3 can only be estimated by a large margin (and depends strongly on the interaction of driver impedance and crossover coil) and should be somewhere between 35-45Hz at 90dB sensitivity.
Since almost nothing is standardized with regard to the manufacturer's specifications, B&W can elegantly pull out of the matter and say "Wait a minute, our specifications refer to a speaker that is standing in the room and not as usual on the basis of anechoic measurements".
With the help of a boundary surface, such as the floor, the speaker comes close to the values in the specification:
View attachment 154852
I have not written a review of the 800D3. There my bad English might have led to a misconception.Dear ctrl, I've read your full review of 800D3.
For this purpose, I always recommend the Arta Handbook by Heinrich Weber. Basically everything you need to know is explained there. For the examples, the Arta measurement software is (mostly) used, but the topics covered can be transferred to any other software.Could you add more details on how you measured near-field LF response? How was the spk positioned? angled forward? laying down sideways on the floor? What was mechanical coupling? Where was the mic? at the floor? between woofers at X sm?

Also this "technique" is all in detail in the Arta Handbook.How did you make sure that the bottom port response and the woofers' response combine at the same ratio as for far-field?

Your English is good enough for me. I am not a native talker either, it's my third language. Ok...I have not written a review of the 800D3. There my bad English might have led to a misconception.
For this purpose, I always recommend the Arta Handbook by Heinrich Weber. Basically everything you need to know is explained there. For the examples, the Arta measurement software is (mostly) used, but the topics covered can be transferred to any other software.
The terms used are also precisely defined there (near field, far field, free field,...).
Example: View attachment 154936
Your question is not easy to answer, because you ask for details about the "ground plane measurement" technique (allows anechoic measurements), but in my example (15'' subwoofer) I used a combination of near field (mic a centimeter from the driver) and far field measurement (a gated in room measurement).
Also this "technique" is all in detail in the Arta Handbook.
View attachment 154944
How this is implemented using REW and VCAD has been shown by @napilopez in the thread "How to make quasi-anechoic speaker measurements/spinoramas with REW and VituixCAD".
With large loudspeakers where the BR ports and woofers are located far away and have large differences in delay at the listening position, it can be useful to take this phase shift into account when combining near-field and far-field measurements - e.g. 2-way loudspeaker or with high crossover frequency of the woofer, in these cases, the phase shift could have an effect when adding the higher frequency components..
? if we lived in 1D space the sound would never become softer, will be able to listen to it at any distance at the same loudness. If we lived in 2D space, then a pulse emitted by a point source would decay accordingly to the law conservation energy, 3dB per each doubling of distance. As we live in the 3D space, we have to live with sound decaying by 6dB per each doubling of the sound distance. If your mic is 10sm away from the woofer, and 50sm away from the port, then this port IR you may not add the port appropriately because it's 5 times softer.Just seen 801 D4 measurement in new HiFi News Mag
Very average FR, to put it lightly
These are made for people that want to show off and existing people upgrading that are happy with the house sound
Not made for well balanced / neutral playback
Is it that surprising that some people are finding them the best thing out there? It would be mildly surprising if that weren't the case, irrespective of the fact that B&W designs from 45 years ago were probably performing equally well, if not overall better. The applause and support happens with most new products these days, if the reviews are anything to go by.This is a post meant to communicate the leak of new D4 like, there is already a thread where people started fighting over the D3 series and older, one side saying it has some high frequency peaking, and the other side saying they have listened by them self and find them the best thing out there.
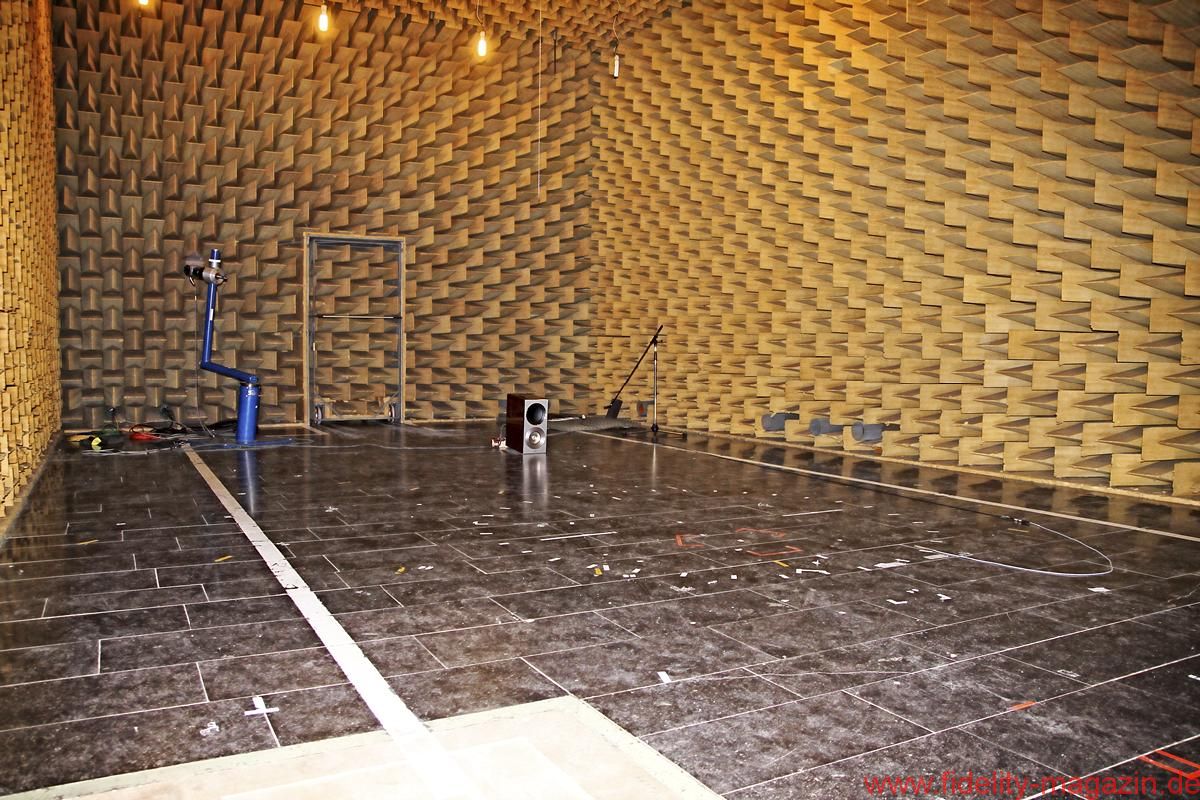
Thanks for sharing the link to the measurements of the Bowers & Wilkins 800 D3. Therein, the test chamber is described as being "constructed as an anechoic half-space with an absolutely reverberant concrete floor and enables free field conditions from approximately 100 Hz upwards."800D3
Dimensions: HxWxD 1.2m x 0.41m x 0.61m - about 1m height for the woofers.
Between 100 and 70Hz the 800D3 has a slight hump, a bass boost, which is at 92dB sound pressure level, but sensitivity is about [email protected].
As mentioned before, f3=37Hz and f6=29Hz (a second source, audio.de 04 /2017, measured the same f6=29Hz). The BR tuning frequency is about 26Hz (see impedance plot).
View attachment 154695
Source: fidelity-online.de
I want to ay that half anechoic would mean that only the walls are anechoic but their claim of that being free field would still be a contradiction.Thanks for sharing the link to the measurements of the Bowers & Wilkins 800 D3. Therein, the test chamber is described as being "constructed as an anechoic half-space with an absolutely reverberant concrete floor and enables free field conditions from approximately 100 Hz upwards."
Can anyone provide an explanation as to how a test chamber with an "absolutely reverberant concrete floor" can enable "free field conditions from approximately 100 Hz upwards"? Reverberant and anechoic would seem to be diametrically opposed. Admittedly, the sound pressure response measurements look to be quite reasonable, but are they affected by measurement errors caused by the sound-reflective floor?
View attachment 155309
Source: fidelity-online.de
Harking back to the B&W DM6 of 1975 vintage (see below), why is the measured response apparently so much smoother, falling within ±1dB limits between 70Hz and 15kHz, than those of the 801 D4 and 800 D3? Has there been a major change in design philosophy?
Thanks for sharing the link to the measurements of the Bowers & Wilkins 800 D3. Therein, the test chamber is described as being "constructed as an anechoic half-space with an absolutely reverberant concrete floor and enables free field conditions from approximately 100 Hz upwards."
Can anyone provide an explanation as to how a test chamber with an "absolutely reverberant concrete floor" can enable "free field conditions from approximately 100 Hz upwards"?
Because they use the ground plane measurement method where the floor reflection doesn't play a role:Can anyone provide an explanation as to how a test chamber with an "absolutely reverberant concrete floor" can enable "free field conditions from approximately 100 Hz upwards"? Reverberant and anechoic would seem to be diametrically opposed. Admittedly, the sound pressure response measurements look to be quite reasonable, but are they affected by measurement errors caused by the sound-reflective floor?