• Welcome to ASR. There are many reviews of audio hardware and expert members to help answer your questions. Click here to have your audio equipment measured for free!

Audio by Van Alstine ABX Comparator Review

Not sure what the problem is. I'm pretty sure I fixed the initial mistake in my files. For 60 µs, which is what I aimed for, you should use 6 samples @ 96 kHz.

Logically, it makes sense to me that the ripple would emerge: If you add two time-shifted copies @-40 dB to one track, the difference to the original are the two echoes. If you add one time-shifted copy @-40 dB to each original track, the nominal difference between them is the same: The two echoes. But one will have its sign flipped.
The sign flipped means the added spectra will cancel, right? I mean cancel in terms of doing a delta spectra graph.

Also, the reason I made the files with just 2 sample offset is because I thought it would show something similar to a rolloff of high frequencies in the audible band. But then I was faced with seeing that the delta of spectra didn't have the ripple.
 
Last edited:
The sign flipped means the added spectra will cancel, right? I mean cancel in terms of doing a delta spectra graph.

Also, the reason I made the files with just 2 sample offset is because I thought it would show something similar to a rolloff of high frequencies in the audible band. But then I was faced with seeing that the delta of spectra didn't have the ripple.
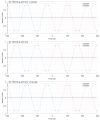
This very ugly sketch should explain the flipped sign better than a thousand more words ;)

Sketch.jpg


I checked my files again and they appear to be OK, but maybe Audacity is doing something I don't want it to when merging tracks.
 
This very ugly sketch should explain the flipped sign better than a thousand more words ;)

View attachment 563462

I checked my files again and they appear to be OK, but maybe Audacity is doing something I don't want it to when merging tracks.
I was wondering the same about Audacity. But now we know we are using the same method for mixing. At least I think so.
 
This very ugly sketch should explain the flipped sign better than a thousand more words ;)

View attachment 563462

I checked my files again and they appear to be OK, but maybe Audacity is doing something I don't want it to when merging tracks.
In your second sketch, the pre echo and post echo have the same spectra so when you subtract one from the other you are left with zero. I could be wrong but that is what I am getting in DW too.
 
Maybe I've made a mistake somewhere when editing in Audacity or there is something not working as I expect it to when mixing the tracks. I don't know.
 
Maybe I've made a mistake somewhere when editing in Audacity or there is something not working as I expect it to when mixing the tracks. I don't know.
I am not sure the point about whether the delta of spectra shows ripple matters anyway. Obviously there is a difference between the signal with pre echo and the one with post echo. With enough delay between tracks, I would expect the difference to be audible. So I think the -40dB crosstalk is important.
 
In contrast, the original vs. -3 samples delay would look like this
That doesn't seem right to me. With 3 sample delay at 44.1k sample rate I would expect a dip at 7350 Hz (and then another one at 22k), because that frequency gets 180° phase change at such delay:
plot.sin.png

Logically, it makes sense to me that the ripple would emerge: If you add two time-shifted copies @-40 dB to one track, the difference to the original are the two echoes. If you add one time-shifted copy @-40 dB to each original track, the nominal difference between them is the same: The two echoes. But one will have its sign flipped.
This very ugly sketch should explain the flipped sign better than a thousand more words
In time domain, yes, but the discussion, AFAICT, was about the delta of spectra. From my experiments:
  • Original vs Original with -40 dB -3 sample shift -- gets dips at 7350 Hz and 22 kHz,
  • Original vs Original with -40 dB +3 sample shift -- gets exactly the same dips at 7350 Hz and 22 kHz,
  • Original vs Original with-40 dB -3 and +3 sample shift -- gets dips at 7350 Hz and 22 kHz that are 2 time larger,
  • Original with -40 dB -3 sample shift vs Original with -40 dB +3 sample shift -- cancel out (ie. the magnitude spectrum of both is the same)
Here are spectrums of 1 second linear sweep. These are not deltas, but because the spectrum of the "Original" is flat, the deltas would look the same. And the delta between -3 and +3 samples would be flat.
fft.linear_sweep-delay.png
 

Attachments

Last edited:
Ok, only page #35, that is just the starter at ASR, I know.
But most questions, if not all, that where desired to be answered, are answered, and some additional ones too.

This rocket was launched by a couple of engaged ASR-Members ( more than several thumbs up) and released a satelite for evaluating, that finally resulted in mostly expected, or, in other words, not so unrealistic .. uhm ... results.
These were summarized in this thread before, and further discussion of side-effects may be substantial, but not necassary to understand the obvious flaws of the discussed item.
An alternative to this is in progress thanks to @mcdn , and this is, for me personally, the real positive and progressive effekt of this discussion.
The rest is running in circles/orbits until page infinte.
 
Ran some more tests, computing the transfer function (input vs output) of the AVA and under different conditions.

First, amplitude:
AVA ABX Comparator blind testing Audio Transfer function amplitude comparison Measurement.png

The thicker line on top shows the response of input a vs B. As you see they land on top of each other and show that roll off which I showed in the review. Analyzer input impedance is kept at 100K Ohm so this is the best case scenario.

Keeping everything the same but lowering the volume in AVA to 90 results in the brown line. That is at the default 20 ohm output impedance of the analyzer. Seeing how DACs tend to have higher impedance, I ratcheted that up to 100 ohm and then 600 Ohm. The lines move due to resistive voltage divider with that of the AVA input. Zooming however, we see some difference in the roll off:
AVA ABX Comparator blind testing Audio Transfer function amplitude comparison zoomed Measurement.png


This is a comparison of 20 ohm vs 600 Ohm showing a non-flat response, albeit very small amount.

The phase response more clearly shows the non-flat impact of source impedance changes:
AVA ABX Comparator blind testing Audio Transfer function Phase comparison Measurement.png


In plain English, the input function (of course) is a complex function as is the source (cable/analyzer) so we see more than resistive difference.

They are all small numbers so nothing to get excited about. But for those of you with more patience than me :), you have more data to analyze with respect to input loading being different if the output impedance of the DACs is different.

Ideally none of these factors would be in play. The device needs to be fully transparent in audio band, like a mechanical switch would be.
 
Josh reported in one (?) case he did not adjust levels with the AVA. In that comparison, the AVA is not doing anything useful other than randomizing switching -- something that can be done with a helper. Wonder if Josh would be willing to repeat those tests with a simple mechanical switcher. And if he passes, this time capture and provide the outputs to us.
 
Chris is writing this:

"I have no idea how ASR folks see themselves. "

Happy to tell you. :) We see ourselves across a spectrum but with a strong shared goal: we want to know the truth. We don't delude ourselves with faulty listening tests that result in totally improper outcomes. We don't go by price, reputation or what some reviewer says. We want hard data and reliable proof before we go along with opinions.

Here, we have a listening test that strains credibility. Kind of like saying you flapped your arms really hard and could fly. Possible I guess but very unlikely.

We wanted data but were hamstrung by not being able to acquire the AVA comparator. Josh would not loan it to me for measurement. Shocking that someone would seek objective truth in audio and do all this testing but not wanting to find out if there can be an explanation in the form of the comparator. This got resolved with a lot of back and forth and money. We now have data that shows one can easily pass AB tests with flying colors even if the sources are identical. Josh says he avoided this scenario but once again, we don't have data to confirm as he refused to give us captured files of what he was listening to.

Let's say Josh's results are right and you all are vindicated that you could hear differences between DACs all along. Why not borrow the box and see if you can pass such AB tests? Or have some other audiophile near Josh repeat the test if he didn't want to lend it to you either.

Opportunity still exists. As I post above, Josh says he has some DACs with similar output levels. Borrow those and perform the test. As a minimum, you will learn what a proper listening feels like. Write a report on that. Don't keep complaining about us.
 
That doesn't seem right to me. With 3 sample delay at 44.1k sample rate I would expect a dip at 7350 Hz (and then another one at 22k), because that frequency gets 180° phase change at such delay:
Yes, there seems to be a problem with my -3 samples file, while the +3 samples is looking good. Naturally, the comparison between them will thereby also give the wrong result :confused:
 
Yes, there seems to be a problem with my -3 samples file, while the +3 samples is looking good. Naturally, the comparison between them will thereby also give the wrong result :confused:
It is easy to have your selection a sample or two off in Audacity. I never remember how it works so have to check the sample number in the selection toolbar and then double check on file length after cutting or adding. Probably I just don't have command of the app.
 
Maybe with a very small delay, but with a longer delay difference it can be very similar to the passband ripple that you were able to notice in your DAC recordings ABX.
Oh no, this is a misconception and it might confuse the issue. The ripple that comes from D10s is real and is measured same as with frequency response measurement, independent on DW difference calculated from the test files. Remember that magnitude frequency response is measured from the output only and that the measurement does not know and does not care if there is a time delay from input to output. It would be absurd if a mere time delay would result in frequency response ripple. Latency would then create ripple.
You can also visit the DAC test files thread where is a filtered file by j_j with +/-1 dB ripple and this file has no time delay from the original and can be directly subtracted, in other words there is no sample shift. Once again, please do not confuse the issue that has already been confused enough by many incorrect assumptions.

BTW, DW “delta of spectra” has been calculated by DW after it automatically removed difference in time alignment.
 
Last edited:
The most important parameter of the box is the output resistance of the AB box as this is a passive attenuator.
The input has been measured at 20k and will vary only slightly with with a different load resistance and that will be trim setting dependent.

The output resistance of the box calculates as follows:
-1.6dB attenuation = factor 0.832 and when the load is 100k this means that 0.832x2V is 1.66V across the 100k. This means that 0.336V drops across the AB box internal resistance.
As the output R of the box and 100k input R are in series there is voltage division. This allows us to calculate the box's internal resistance as the ratio between the voltage across the box and the AP and resistance is the same. The ratio is 4.94x. This calculates as 20.24k.
It is that resistance, combined with the load capacitance (chip, wiring, PCB, cable, load input capacitance) that determines the roll-off of different frequencies.
That output resistance will change with trimming and is likely the cause of the difference in roll-off.
This is easily measured/verified with an ohm meter and important/revealing info.
 
  • Like
Reactions: pma
It is that resistance, combined with the load capacitance (chip, wiring, PCB, cable, load input capacitance) that determines the roll-off of different frequencies.
That output resistance will change with trimming and is likely the cause of the difference in roll-off.
This is easily measured/verified with an ohm meter and important/revealing info.
Easily measured, even more easily and precisely simulated, as these are the most trivial transfer functions close to 1-pole filters. Frankly, AP is not the best for this, REW has more user options, immediate relative level alignment etc.

It is almost certain that the AVA in combination with HPA4 input did not change the relative frequency response (meaning if the attenuation was properly set) in any audible manner. It also did not create any considerable load for DACs under test. This intelectual path seems to be blind.
I have received a personal email from @SIY with his opinion, however it is impossible to present it in public.
 
It is almost certain that the AVA in combination with HPA4 input did not change the relative frequency response (meaning if the attenuation was properly set) in any audible manner.
Well, by that logic, the difference in DACs is not any kind of "audible manner" either!

Fact remains that we don't know what method was really used for level matching. If Josh knew that matching with AVA output resulted in wrong levels, he should have clearly expressed that. Just like I did: with shock and horror. We are left with a bunch of tea leaf reading because no accurate accounting was provided, nor any sample files.

As far as I am concerned, this box makes it trivial to set things up wrong and arrive at "obvious" differences between A and B. And that is the most likely explanation of telling a number of DACs apart.

You have another theory of why this was so easy, or something @SIY whispered in your ears about that, let's see that. Otherwise, I don't know where this comment came from.
 
This is easily measured/verified with an ohm meter and important/revealing info.
And by ear! Indeed, it was my ears that instantly told me something was way off, making the blind test a walk in the park to pass. Which is what we have from Josh.

I have yet to see a theory of why this problem was not noted by Josh at the start because if it were, we would not have even needed to buy the bloody comparator. We would have known how easy it is to get the levels wrong and that would have been that in my book.
 
Oh no, this is a misconception and it might confuse the issue. The ripple that comes from D10s is real and is measured same as with frequency response measurement, independent on DW difference calculated from the test files. Remember that magnitude frequency response is measured from the output only and that the measurement does not know and does not care if there is a time delay from input to output. It would be absurd if a mere time delay would result in frequency response ripple. Latency would then create ripple.
You can also visit the DAC test files thread where is a filtered file by j_j with +/-1 dB ripple and this file has no time delay from the original and can be directly subtracted, in other words there is no sample shift. Once again, please do not confuse the issue that has already been confused enough by many incorrect assumptions.

BTW, DW “delta of spectra” has been calculated by DW after it automatically removed difference in time alignment.
It isn't the delay in itself that is the problem when using the box. It would not be a problem at all if there were no crosstalk. But with crosstalk being so great (-40dB) then the difference in delay in one DAC compared to the other one causes the echoes. So these echoes are just as real as filter passband ripple echoes. Completely different effect, but very similar in form.

Also, the difference in spectra in DW is the same whether I just load the files without time alignment or do full matching, just as it should be.
 
Back
Top Bottom