Thank you. I will watch the video.If the ripple is bad enough, OR the "bump" at the ends of an overly shortened remez optimization is big enough, the effect can be audible. Most filters these days are not optimized that way any more. Unfortunately, some still persist in half-band filters, which has a different problem in the math end of things. Now, the "bump" generally does equate to passband ripple, usually.
The analysis to use is an erb by erb analysis using the appropriate time interval for each ERB, or better even a 1/3 ERB calculation, done the same way. Look suspiciously at any filter that starts to show up before the 'middle'.
I did a talk a while ago on time vs. frequency vs. bandwidth. Let me see if it's still available.

2022-11-17-What is "Bandwidth?" - PNW AES Section
What is “Bandwidth?” And Why Do I Care? Presented by James D. (jj) Johnston AES Fellow, Chief Scientist of Immersion Ne With Bob Smith, SoundSmith Labs, PNWAES Vice Chair Our presenter for the evening, James D. (jj) Johnston, AES Fellow, PNWAES Committee Member, Technical Advisor, and Chief...pnw.aessections.org

-
Welcome to ASR. There are many reviews of audio hardware and expert members to help answer your questions. Click here to have your audio equipment measured for free!
You are using an out of date browser. It may not display this or other websites correctly.
You should upgrade or use an alternative browser.
You should upgrade or use an alternative browser.
Audibility thresholds of amp and DAC measurements
- Thread starter flipflop
- Start date

solderdude
Grand Contributor
When you record with a higher bitrate and bit depth than the used playback file the 'degradation' is extremely small and will certainly capture all the distortion that is present.Undoubtedly. But you wouldn't deny that every transformation introduces irreversible changes, would you?
In this case, the A/D converter introduces a highly undesirable element of uncertainty.
I would not call it highly undesirable as if the recording was utterly useless. Loopback tests of DAC-ADC-DAC-ADC have shown this many times not to be the case in practice using music.
IF it is audible it is already highly measurable and any changes made by the ADC would be similar for both DACs and not show up in a null.
Record the output using a ADC and you will have shown the difference to really exist.Suggest another option that could result in the bass from one of the sources sounding not as a single note but as entire chords when using the same speakers.
The 2nd harmonic of 10kHz is above the audible range. It will be VERY small anyway so even when it mirrors against the amplitude will be small.I noted that these distortions were measured at 10 kHz. Bass was mentioned as an example of a recording: bass guitar, especially when played with a pick, and pizzicato on the double bass.
Which bass has high amounts of 10kHz + (unless the file was clipping) ?
These values mean absolutely NOTHING for any music recording as the are way below any noise floor in practice.It is suitable, but with significant limitations. The typical dynamic range of a single channel of the es9039q2m is 130 dBA, while that of a single channel of the es9822pro is 124 dBA. The effect of ADC distortion will require a separate study.
Also dBA is a weird way choice to compare anything, it just makes for lower numbers because of the weighting.
So that cannot possibly be a reason for hearing more distortion or a different tone. That must come from something else.
Last edited:

RandomEar
Major Contributor
- Joined
- Feb 14, 2022
- Messages
- 1,435
- Likes
- 3,814
Ahhh, bass as in the instrument. OK. But at the same time, you mention that it's important that your headphone starts at 6 Hz... how would that link to HF distortion?[...]
I noted that these distortions were measured at 10 kHz. Bass was mentioned as an example of a recording: bass guitar, especially when played with a pick, and pizzicato on the double bass.
But again: The ADC captured everything in the recording and then the DAC playing it back is significantly better in most metrics than the ADC. So I do not see which part of this chain could be problematic. You will certainly "stack" errors by repeatedly playing back and recording things because no device is perfect, but capturing the output of a DAC once for analysis is still a perfectly legit thing to do.It is suitable, but with significant limitations. The typical dynamic range of a single channel of the es9039q2m is 130 dBA, while that of a single channel of the es9822pro is 124 dBA. The effect of ADC distortion will require a separate study.
Yes, localized differences can look big on that zoomed-in scale. But that filter ringing and the distortion at 10 kHz you quote would end up around 20 kHz. Unless you're a good bit younger than 20, that's outside of the audible range. And it would be really, really low in level anyway. I would only expect a possible audible difference if one of the filters were a slow roll-off type. You mention a "linear-slow" filter but also say that the frequency responses were more or less identical between the DACs. So that's probably not it. This is all very vague. What DAC model are we even talking about?Exactly. Right at the beginning of this discussion, I attributed this difference to the high-frequency range, which is why I cited the distortion figures for 10 kHz. By the way, when using these filters and taking ringing into account, the difference in a same meander front heights is 1.5–2 dB.
[...]

I've got to point out that IMD above any reasonable idea of the auditory bandwidth can easily create signals well within the audible range, including in places that are extremely easy to detect at very low levels. (For instance, ear canal resonance)
nick_l44.1
Active Member
- Joined
- Jan 11, 2024
- Messages
- 124
- Likes
- 84
Thus, to study the presumed effect of unknown nature that arises in the DAC–HP–ear system, you propose removing the two most nonlinear elements and replacing them with an ADC. I have no idea how this would help with the analysis.IF it is audible it is already highly measurable and any changes made by the ADC would be similar for both DACs and not show up in a null.
We're talking about audible distortion effects, right?Record the output using a ADC and you will have shown the difference to really exist.
You asked your question right below my reply. I didn't ask whether it's possible to hear the distortion harmonics from the high-frequency tones directly.Which bass has high amounts of 10kHz + (unless the file was clipping) ?
Noise floor is not a line. If you look at a pure sine wave with a level of -90 to -100 dB played back on a DAC with a dynamic range of 130 dBA, it will be severely distorted, to the point of being visually unrecognizable.These values mean absolutely NOTHING for any music recording as the are way below any noise floor in practice.
Also dBA is a weird way choice to compare anything, it just makes for lower numbers because of the weighting.
No problem. 130 dBA = 127 dB [20–20000 Hz]
Indeed. You've made a good point—it is an unusual combination—but I'm not referring specifically to distortion, but rather to a more accurate reproduction of sharp sounds. Maybe I shouldn't have mentioned THD; it always causes confusion.you mention that it's important that your headphone starts at 6 Hz... how would that link to HF distortion?
Setting aside what I wrote above about excluding highly nonlinear headphones and human hearing from the analysis, using an ADC is a very useful method. However, it has significant limitations. For example, to prevent the ADC’s noise from affecting the DAC’s noise measurement, the ADC’s noise must be at least 10 dB lower. To accurately measure the DAC’s dynamic range, you need to use an amplifier; to accurately measure THD+N, you need to use a notch filter. When recording music with a full dynamic range, it is impossible to use such additional devices before the ADC. This means it is very difficult to assess the accuracy of the results, especially in my case, where the DACs I’m using outperform the ADC in many respects.capturing the output of a DAC once for analysis is still a perfectly legit thing to do
I wasn't referring to fluctuations, but rather to a slightly louder pulse. Unfortunately, I was in a hurry and didn't think to clarify exactly which filter was being used at the time. I just tried comparing the typical waveforms of suitable filters and didn’t see any significant variation. However, this still needs to be checked under load. These are two e1da 9039s models. The first is a pre-release prototype from 2.5 years ago; the second is a recently released unit. The new dongle has an increased power buffer of 4,500 μF compared to 3,000 μF in the prototype. And the capacitors in the new model are solid-polymer instead of tantalum, with better ESR. Under these conditions, one would expect a better slew rate under load. THD@10k should have shown this to some extent. The frequency response under load also confirms this, but all the differences are minor. So far, the version with the filter seems the most promising, especially since the differences between the filters can be heard.Yes, localized differences can look big on that zoomed-in scale. But that filter ringing and the distortion at 10 kHz you quote would end up around 20 kHz. Unless you're a good bit younger than 20, that's outside of the audible range. And it would be really, really low in level anyway. I would only expect a possible audible difference if one of the filters were a slow roll-off type. You mention a "linear-slow" filter but also say that the frequency responses were more or less identical between the DACs. So that's probably not it. This is all very vague. What DAC model are we even talking about?
Oh, that really does describe certain sensations perfectly. When something starts to tickle gently inside the ear.ear canal resonance
RandomEar
Major Contributor
- Joined
- Feb 14, 2022
- Messages
- 1,435
- Likes
- 3,814
I still think my main point didn't come across: You're talking about DAC noise floor and distortion. But an ADC was used to capture the music. It was very likely worse than the DAC you use to listen to it. So the recording determines the noise floor and distortion limits. Yes, the DAC adds some of both while playing it back, but the major portion should be coming from what's in the recording you listen to.[...]
Indeed. You've made a good point—it is an unusual combination—but I'm not referring specifically to distortion, but rather to a more accurate reproduction of sharp sounds. Maybe I shouldn't have mentioned THD; it always causes confusion.
Setting aside what I wrote above about excluding highly nonlinear headphones and human hearing from the analysis, using an ADC is a very useful method. However, it has significant limitations. For example, to prevent the ADC’s noise from affecting the DAC’s noise measurement, the ADC’s noise must be at least 10 dB lower. To accurately measure the DAC’s dynamic range, you need to use an amplifier; to accurately measure THD+N, you need to use a notch filter. When recording music with a full dynamic range, it is impossible to use such additional devices before the ADC. This means it is very difficult to assess the accuracy of the results, especially in my case, where the DACs I’m using outperform the ADC in many respects.
If you want to determine the inaudible absolute performance limits of a DAC, your ADC needs to be better than the DUT - no question. But that's not what we are looking for here. We are trying to determine if there are audible differences in distortion, bandwidth or maybe phase. Refusing to measure the DACs based on the assumption that the ADC performs worse and that differences might be too small to be captured doesn't seem like a useful way to approach the problem. If you have the measurements and then still can't pinpoint the problem, you can worry about the edge cases. But not beforehand.
OK. Still, this seems to be the same problem as before: The differences might exist, but they might also come down to simple sighted bias. So any theorizing which small change might cause them seems like a wasted effort to me until a well controlled test has established that they do, in fact, exist.I wasn't referring to fluctuations, but rather to a slightly louder pulse. Unfortunately, I was in a hurry and didn't think to clarify exactly which filter was being used at the time. I just tried comparing the typical waveforms of suitable filters and didn’t see any significant variation. However, this still needs to be checked under load. These are two e1da 9039s models. The first is a pre-release prototype from 2.5 years ago; the second is a recently released unit. The new dongle has an increased power buffer of 4,500 μF compared to 3,000 μF in the prototype. And the capacitors in the new model are solid-polymer instead of tantalum, with better ESR. Under these conditions, one would expect a better slew rate under load. THD@10k should have shown this to some extent. The frequency response under load also confirms this, but all the differences are minor. So far, the version with the filter seems the most promising, especially since the differences between the filters can be heard.

danadam
Major Contributor
- Joined
- Jan 20, 2017
- Messages
- 1,665
- Likes
- 2,575
Here's -90 dBFS 1 kHz sine through a few DACs. I wouldn't call it "being visually unrecognizable".Noise floor is not a line. If you look at a pure sine wave with a level of -90 to -100 dB played back on a DAC with a dynamic range of 130 dBA, it will be severely distorted, to the point of being visually unrecognizable.

New 28-bit DAC coming out.
I feel that I have to comment on the review from Bob Katz on this new ‘multi-path’ DAC design, because people in this thread seem to think the measurements of the unnamed 'standard' DAC were from an ADI-2 DAC FS. As you will see this is definitely not the case. Furthermore the review...
www.audiosciencereview.com
nick_l44.1
Active Member
- Joined
- Jan 11, 2024
- Messages
- 124
- Likes
- 84
Yes, your idea that the recordings already contain a fair amount of noise and that re-converting them via A/D conversion might not distort the sound as much is not without merit. However, digitized versions almost always sound different from the original recordings. An ADC has its own frequency response and its own distortions, which require significant correction under extreme conditions. I also don’t see the point in re-digitizing music. Measuring a DAC is a different matter. I did take some frequency response measurements, but I didn’t even save them because the differences were so minor. Any other suggestions?I still think my main point didn't come across: You're talking about DAC noise floor and distortion. But an ADC was used to capture the music. It was very likely worse than the DAC you use to listen to it. So the recording determines the noise floor and distortion limits. Yes, the DAC adds some of both while playing it back, but the major portion should be coming from what's in the recording you listen to.
If you want to determine the inaudible absolute performance limits of a DAC, your ADC needs to be better than the DUT - no question. But that's not what we are looking for here. We are trying to determine if there are audible differences in distortion, bandwidth or maybe phase. Refusing to measure the DACs based on the assumption that the ADC performs worse and that differences might be too small to be captured doesn't seem like a useful way to approach the problem. If you have the measurements and then still can't pinpoint the problem, you can worry about the edge cases. But not beforehand.
Of course, I acknowledged the possibility of a placebo effect right from the start. I’m not trying to solve the problem; I’m just exploring the situation. This isn’t a waste of time, since I’ve already identified some possible scenarios that aren’t difficult to test. Full-scale experiments are beyond my budget, since this isn’t a professional endeavor.OK. Still, this seems to be the same problem as before: The differences might exist, but they might also come down to simple sighted bias. So any theorizing which small change might cause them seems like a wasted effort to me until a well controlled test has established that they do, in fact, exist.
You misunderstood. Your ADC was only operating within a portion of the dynamic range. Here’s your quote:I wouldn't call it "being visually unrecognizable".
Nevertheless, even with a gain of +26 dB, the effect of noise is visible. Try to imagine what it would look like if the noise were 20 times greater.captured through E1DA Scaler at max amplification
solderdude
Grand Contributor
What I propose is to verify a difference in an objective way without the systems that are highly unreliable .... namely the HP-ear system. That is by far the biggest contributor of nonlinearity.Thus, to study the presumed effect of unknown nature that arises in the DAC–HP–ear system, you propose removing the two most nonlinear elements and replacing them with an ADC. I have no idea how this would help with the analysis.
Analyze that difference you claim to hear and listen to the null for instance.
First step is proving there is a potentially audible difference.
Which is done using an .... ADCMeasuring a DAC is a different matter.
One thing is for sure any differences you hear in music are unlikely to be below -70dB let alone -100dB.
RandomEar
Major Contributor
- Joined
- Feb 14, 2022
- Messages
- 1,435
- Likes
- 3,814
I'm not a sound engineer, so other members might have a better idea where to start. But if asked, I think I would look at a THD+N sweep over the audible frequency range at a fixed level and a level sweep for a couple of freqs, plus the same for IMD (using two freqs). That should give you a rough idea if there's any immediately obvious problem.Yes, your idea that the recordings already contain a fair amount of noise and that re-converting them via A/D conversion might not distort the sound as much is not without merit. However, digitized versions almost always sound different from the original recordings. An ADC has its own frequency response and its own distortions, which require significant correction under extreme conditions. I also don’t see the point in re-digitizing music. Measuring a DAC is a different matter. I did take some frequency response measurements, but I didn’t even save them because the differences were so minor. Any other suggestions?
If not, the question would be if the impedance of your headphones is more problematic and the likely much higher input impedance of the analyzer might mask some effects. It also does not address your idea of differences in rise time, but if the FR is flat I would not look at that property as a first step.
Fair enough. Maybe the first results would be a good basis for a new thread, since this one is more of a global discussion about audibility thresholds and your problem is specific to one device.Of course, I acknowledged the possibility of a placebo effect right from the start. I’m not trying to solve the problem; I’m just exploring the situation. This isn’t a waste of time, since I’ve already identified some possible scenarios that aren’t difficult to test. Full-scale experiments are beyond my budget, since this isn’t a professional endeavor.
[...]
nick_l44.1
Active Member
- Joined
- Jan 11, 2024
- Messages
- 124
- Likes
- 84
I think that replacing one nonlinear analyzer with another, even if it's slightly different, still won't be particularly objective.What I propose is to verify a difference in an objective way without the systems that are highly unreliable .... namely the HP-ear system. That is by far the biggest contributor of nonlinearity.
The typical measurements for these units won’t differ significantly. It’s possible that THD@10k@32Ohm will be the biggest difference. Incidentally, measuring THD+N in the audible range is usually quite inaccurate and not very informative due to high levels of masking noise and harmonics extending beyond the measured range. It’s more interesting to measure just THD over a wider range, although the same accuracy issues apply there as well.But if asked, I think I would look at a THD+N sweep over the audible frequency range at a fixed level and a level sweep for a couple of freqs, plus the same for IMD (using two freqs). That should give you a rough idea if there's any immediately obvious problem.
Of course. This is most likely a very specific characteristic—and one that isn’t documented, at that.Fair enough. Maybe the first results would be a good basis for a new thread, since this one is more of a global discussion about audibility thresholds and your problem is specific to one device.
I’ve looked into some characteristics of my dongles that could potentially be related to the audible differences:
* The output level of the new DAC is 0.15 dB higher.
* The frequency response in the low-frequency range is identical (less than 0.01 dB); in the high-frequency range, there is a slight difference of 0.25 dB at 180 kHz. The cutoff frequencies are approximately 126.2 and 126.6 kHz.
* There is virtually no difference in rise time between the various filters. Although I’m not sure we can rule out the influence of different ringing characteristics.
It might also be interesting to compare, by ear, music with the volume reduced by 0.15 dB in the file for the new DAC and to monitor the filters.
Thank you all for participating
danadam
Major Contributor
- Joined
- Jan 20, 2017
- Messages
- 1,665
- Likes
- 2,575
Fair enough. Here's:You misunderstood. Your ADC was only operating within a portion of the dynamic range. Here’s your quote:
- 1 kHz at -90 and -100 dBFS in 44.1k sampling rate,
- played through JCally JM20,
- captured (directly, without scaler) through ADCiso at +10.85 dBu sensitivity in 96k sampling rate (full scale from JM20 lands at -2.7 dBFS)
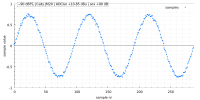 ,
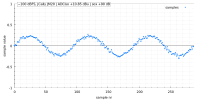
and FFT magnitude:
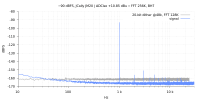 ,
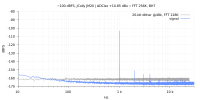
(I added 20-bit dither @48k for reference)
I'd still say that "visually unrecognizable" is exaggerated.
solderdude
Grand Contributor
It is the ONLY objective way.I think that replacing one nonlinear analyzer with another, even if it's slightly different, still won't be particularly objective.
The other way is level matched, blind and statistical valid listening.
There is no other way around this.
Measure first, ensure proper operation, proceed to well executed bling test either using an ADC or directly (not reliable to do when not level matched within 0.1dB)
Every recording (except digitally created ones) go through a similar ADC and given the many wonderful recordings that exist I would not say an ADC is even remotely a problematic device that can't be used to capture audible (thus substantial) changes in and for 192kHz even well outside of the audible band.

I have not read the whole thread, sorry, just dropped in whilst skimming.
Sorry of this has all been covered - Don
Modern audio ADCs are more linear than our ears, headphones, speakers, by a good margin and oversampling offers high frequency analysis.I think that replacing one nonlinear analyzer with another, even if it's slightly different, still won't be particularly objective.
Measuring under load over the full dynamic range might be revealing. I have found THD+N measurements to be very accurate but I am not sure the full context of your statement. Measuring acoustic output from headphones or speakers is significantly different (and harder) than measuring the electrical signals.The typical measurements for these units won’t differ significantly. It’s possible that THD@10k@32Ohm will be the biggest difference. Incidentally, measuring THD+N in the audible range is usually quite inaccurate and not very informative due to high levels of masking noise and harmonics extending beyond the measured range. It’s more interesting to measure just THD over a wider range, although the same accuracy issues apply there as well.
Note 0.15 dB difference in a rapid-switching comparison will be readily audible. Raw frequency response would not account for any audible difference I can imagine. For filters, or just general response, including phase as well as magnitude in the frequency response might better reveal differences. Time-domain response, showing pre- and post-ringing and such, is also more likely to highlight differences. The time-domain response is most often cited for audible differences among anti-image filters at the outputs of DACs, at least IME, and assuming competent roll-off and such. Slower roll-off, or so-called filterless NOS DACs, can have high image spurs that lead to in-band signals through various means both electrical (e.g. mixing and beat frequencies) and mechanical (e.g. cone modulation).I’ve looked into some characteristics of my dongles that could potentially be related to the audible differences:
* The output level of the new DAC is 0.15 dB higher.
* The frequency response in the low-frequency range is identical (less than 0.01 dB); in the high-frequency range, there is a slight difference of 0.25 dB at 180 kHz. The cutoff frequencies are approximately 126.2 and 126.6 kHz.
* There is virtually no difference in rise time between the various filters. Although I’m not sure we can rule out the influence of different ringing characteristics.
It might also be interesting to compare, by ear, music with the volume reduced by 0.15 dB in the file for the new DAC and to monitor the filters.
Thank you all for participating
Sorry of this has all been covered - Don
No. Those caps have nothing to do with slew rate, or distortion. And slew rate hasnt been a problem with audio electronics for 40 years.Under these conditions, one would expect a better slew rate under load. THD@10k should have shown this to some extent.
nick_l44.1
Active Member
- Joined
- Jan 11, 2024
- Messages
- 124
- Likes
- 84
Agree, I was wrong. It was probably DAC noise, not ADC noise. The es9039* series of chips are characterized by high noise levels at frequencies significantly above the operating range. An oscilloscope reveals a broader picture; the ADC filters out this type of noise. That example was quite misleading.I'd still say that "visually unrecognizable" is exaggerated.
Well, let’s say so. I still have two normalized digitized files, which I fed into DeltaWave. If we assume that the differences cannot be attributed to low-level details or the extreme frequencies of the range—which, I believe, is quite likely—then the digitized files can be considered adequate source data.It is the ONLY objective way.
DeltaWave v2.0.25, 2026-08-12
Reference: s3_frtest_audible.flac[L] 8554669 samples 96000Hz 24bits, stereo, MD5=00
Comparison: s26_frtest_audible.flac[L] 8614574 samples 96000Hz 24bits, stereo, MD5=00
Settings:
Gain:True, Remove DC:True
Non-linear Gain EQ:False Non-linear Phase EQ: False
EQ FFT Size:65536, EQ Frequency Cut: 0Hz - 0Hz, EQ Threshold: -500dB
Correct Non-linearity: False
Correct Drift:True, Precision:30, Subsample Align:True
Non-Linear drift Correction:False
Upsample:False, Window:Kaiser
Spectrum Window:Kaiser, Spectrum Size:32768
Spectrogram Window:Hann, Spectrogram Size:4096, Spectrogram Steps:2048
Filter Type:IIR, window:Kaiser, taps:262144, minimum phase=False
Dither:False bits=0
Trim Silence:True
Enable Simple Waveform Measurement: False
Correct for MP DC Filter = False, DC Filter frequency=0,5 Hz
Discarding Reference: Start=0s, End=0s
Discarding Comparison: Start=0s, End=0s
Initial peak values Reference: -4,027dB Comparison: -4,028dB
Initial RMS values Reference: -18,965dB Comparison: -18,996dB
Null Depth=14,897dB
X-Correlation offset: -165 samples
Drift computation quality, #1: Poor (21,6μs)
Trimmed 0 samples ( 0,00ms) front, 0 samples ( 0,00ms end)
Final peak values Reference: -4,027dB Comparison: -4,027dB
Final RMS values Reference: -18,663dB Comparison: -18,663dB
GS: -0,568685 ms, -0,0001 dB (L), -59,7 dBFS (L), [-64,5dBFSA (L)]
Gain= -0,0001dB (1x) DC=0 Phase offset=-0,568685ms (-54,594 samples)
Difference (rms) = -59,74dB [-64,53dBA]
Correlated Null Depth=69,21dB [51,28dBA]
Clock drift: -183,24 ppm
Files are NOT a bit-perfect match (match=1,66%) at 16 bits
Files are NOT a bit-perfect match (match=0,01%) at 24 bits
Files are NOT a bit-perfect match (match=0,01%) at 24 bits
Files match @ 50,0018% when reduced to 9,95 bits
---- Phase difference (full bandwidth): 13,763113266293°
0-10kHz: 12,58°
0-20kHz: 13,34°
0-24kHz: 13,46°
Timing error (rms jitter): 3,3μs
PK Metric (step=400ms, overlap=50%):
RMS=-98,6dBFS
Median=-102,3
Max=-88,0
99%: -89,4
75%: -98,4
50%: -102,31
25%: -106,66
1%: -117,16
gn=1,000007293836, dc=1,02751212295902E-08, dr=-0,000183239357975341, of=-54,5938040842909
DONE!
Signature: de7242501beb6c9d1704f396efdf46e6
RMS of the difference of spectra: -142,717725367899dB
DF Metric (step=400ms, overlap=0%):
Median=-43,7dB
Max=-30,3dB Min=-76,8dB
1% > -73,49dB
10% > -50,2dB
25% > -46,71dB
50% > -43,68dB
75% > -41,54dB
90% > -39,35dB
99% > -30,51dB
Linearity 22,8bits @ 0.5dB error
In other words, this is exactly the pattern one would expect from different FIR filters.
Both units show very good THD+N readings, even under load. This is an unlikely scenario.Measuring under load over the full dynamic range might be revealing. I have found THD+N measurements to be very accurate but I am not sure the full context of your statement. Measuring acoustic output from headphones or speakers is significantly different (and harder) than measuring the electrical signals.
Let me clarify what I meant in more detail.
Measuring THD+N using a good ADC and a notch filter is very accurate and informative. My comments were regarding the measurement of THD+N across the entire audible band.
I consider it insufficiently accurate and not very informative for the following reasons:
1. It is impossible to use a notch filter for arbitrary frequencies, so accuracy will suffer in any case. The lower the DUT’s distortion, the lower the accuracy will be.
2. The noise level is practically a constant value for any measured frequency; it only interferes with observing THD behavior by setting a lower limit on the visibility of the entire graph.
3. The audible range is insufficient for measuring THD at frequencies above 10 kHz. Very often, you can see the graph, which had begun to rise, drop sharply. This always occurs at frequencies where the next harmonic falls outside the measurement range.
4. Expanding the range automatically increases the integral noise level even further, causing even more detail to be lost.
Therefore, the frequency dependence of THD provides more information. Noise also requires a separate measurement.
Well, I have no basis for claiming that there is a cause-and-effect relationship. Given the latest data, it is indeed inappropriate to discuss changes in the slew rate in the case at hand. However, the fact that distortion is lower at high frequencies under load has been reliably established.No. Those caps have nothing to do with slew rate, or distortion.
solderdude
Grand Contributor
Yes, provided you use a higher sample rate than that of the original file reproduced file to ensure the reconstruction filter and anti-aliasing is not in the way, say 2x higher and this is NOT a possible problem anymore.Well, let’s say so. I still have two normalized digitized files, which I fed into DeltaWave. If we assume that the differences cannot be attributed to low-level details or the extreme frequencies of the range—which, I believe, is quite likely—then the digitized files can be considered adequate source data.
But you already knew this.
And you need more than the published report and numbers. You need the plots, analyze them and, you should listen to listen to the null too.
Last edited:

MaxwellsEq
Major Contributor
- Joined
- Aug 18, 2020
- Messages
- 3,782
- Likes
- 6,823
Unfortunately you have made a wrong assumption. If you do a bit of reading, you will discover that phase behaviour close to 0 Hz has a big Deltawave impact when comparing different files.Well, let’s say so. I still have two normalized digitized files, which I fed into DeltaWave. If we assume that the differences cannot be attributed to low-level details or the extreme frequencies of the range—which, I believe, is quite likely—then the digitized files can be considered adequate source data.
MaxwellsEq
Major Contributor
- Joined
- Aug 18, 2020
- Messages
- 3,782
- Likes
- 6,823
To help your understanding as to.why your assumption is wrong, here is further reading to understand how inaudible DC protection and/or high-pass filters close to 0 Hz can significantly affect the values given by Deltawave and other "null" measurement techniquesIf we assume that the differences cannot be attributed to low-level details or the extreme frequencies of the range—which, I believe, is quite likely—then the digitized files can be considered adequate source data.
DAC listening test files - update
Example better than hundreds of explanations: Almost perfect result, hoorah, or rather not? :)The answer is no. foo_abx 2.1 report foobar2000 v2.0 2026-08-08 10:19:45 File A: file_1.wav SHA1: 21b718084cbefae84cc1723ec49976b3c9ffa9ee File B: file_2.wav SHA1...
www.audiosciencereview.com
nick_l44.1
Active Member
- Joined
- Jan 11, 2024
- Messages
- 124
- Likes
- 84
Yes, DeltaWave may be sensitive to low-frequency phase. But in this situation, the measured low-frequency frequency response and phase response of the two DACs, as recorded by the same ADC, are virtually identical; therefore, this mechanism does not explain the observed difference between them.phase behaviour close to 0 Hz has a big Deltawave impact when comparing different files
Meanwhile, after looking into the issue you raised, I found some very interesting details in my old measurements. The information needs to be clarified; I’ll write about it later.
Similar threads

- Replies
- 309
- Views
- 21K


- Replies
- 37
- Views
- 4K


- Replies
- 1
- Views
- 653
- Replies
- 0
- Views
- 799

- Replies
- 15
- Views
- 1K