@NTK thanks for this, just tried it out. Not a mathematician, so some questions; in general: how to interpret the plot? Like: is red cancellation, and is there a way to know which wall contributes to it most? The frequencies output for my room seem to make sense, in that some of the values happen to be roughly those values in which I see issues in mic measurements, but I'm not quite sure if that's just a conincidence - there seems to be no clear system in knowing which frequency would be a cancellation at MLP vs amplification. I'll spend more time later (thinking of entering a simple cuboid to then compare results with other calculators to see which thing modifies what) but I think an explanation could be useful for others as well.
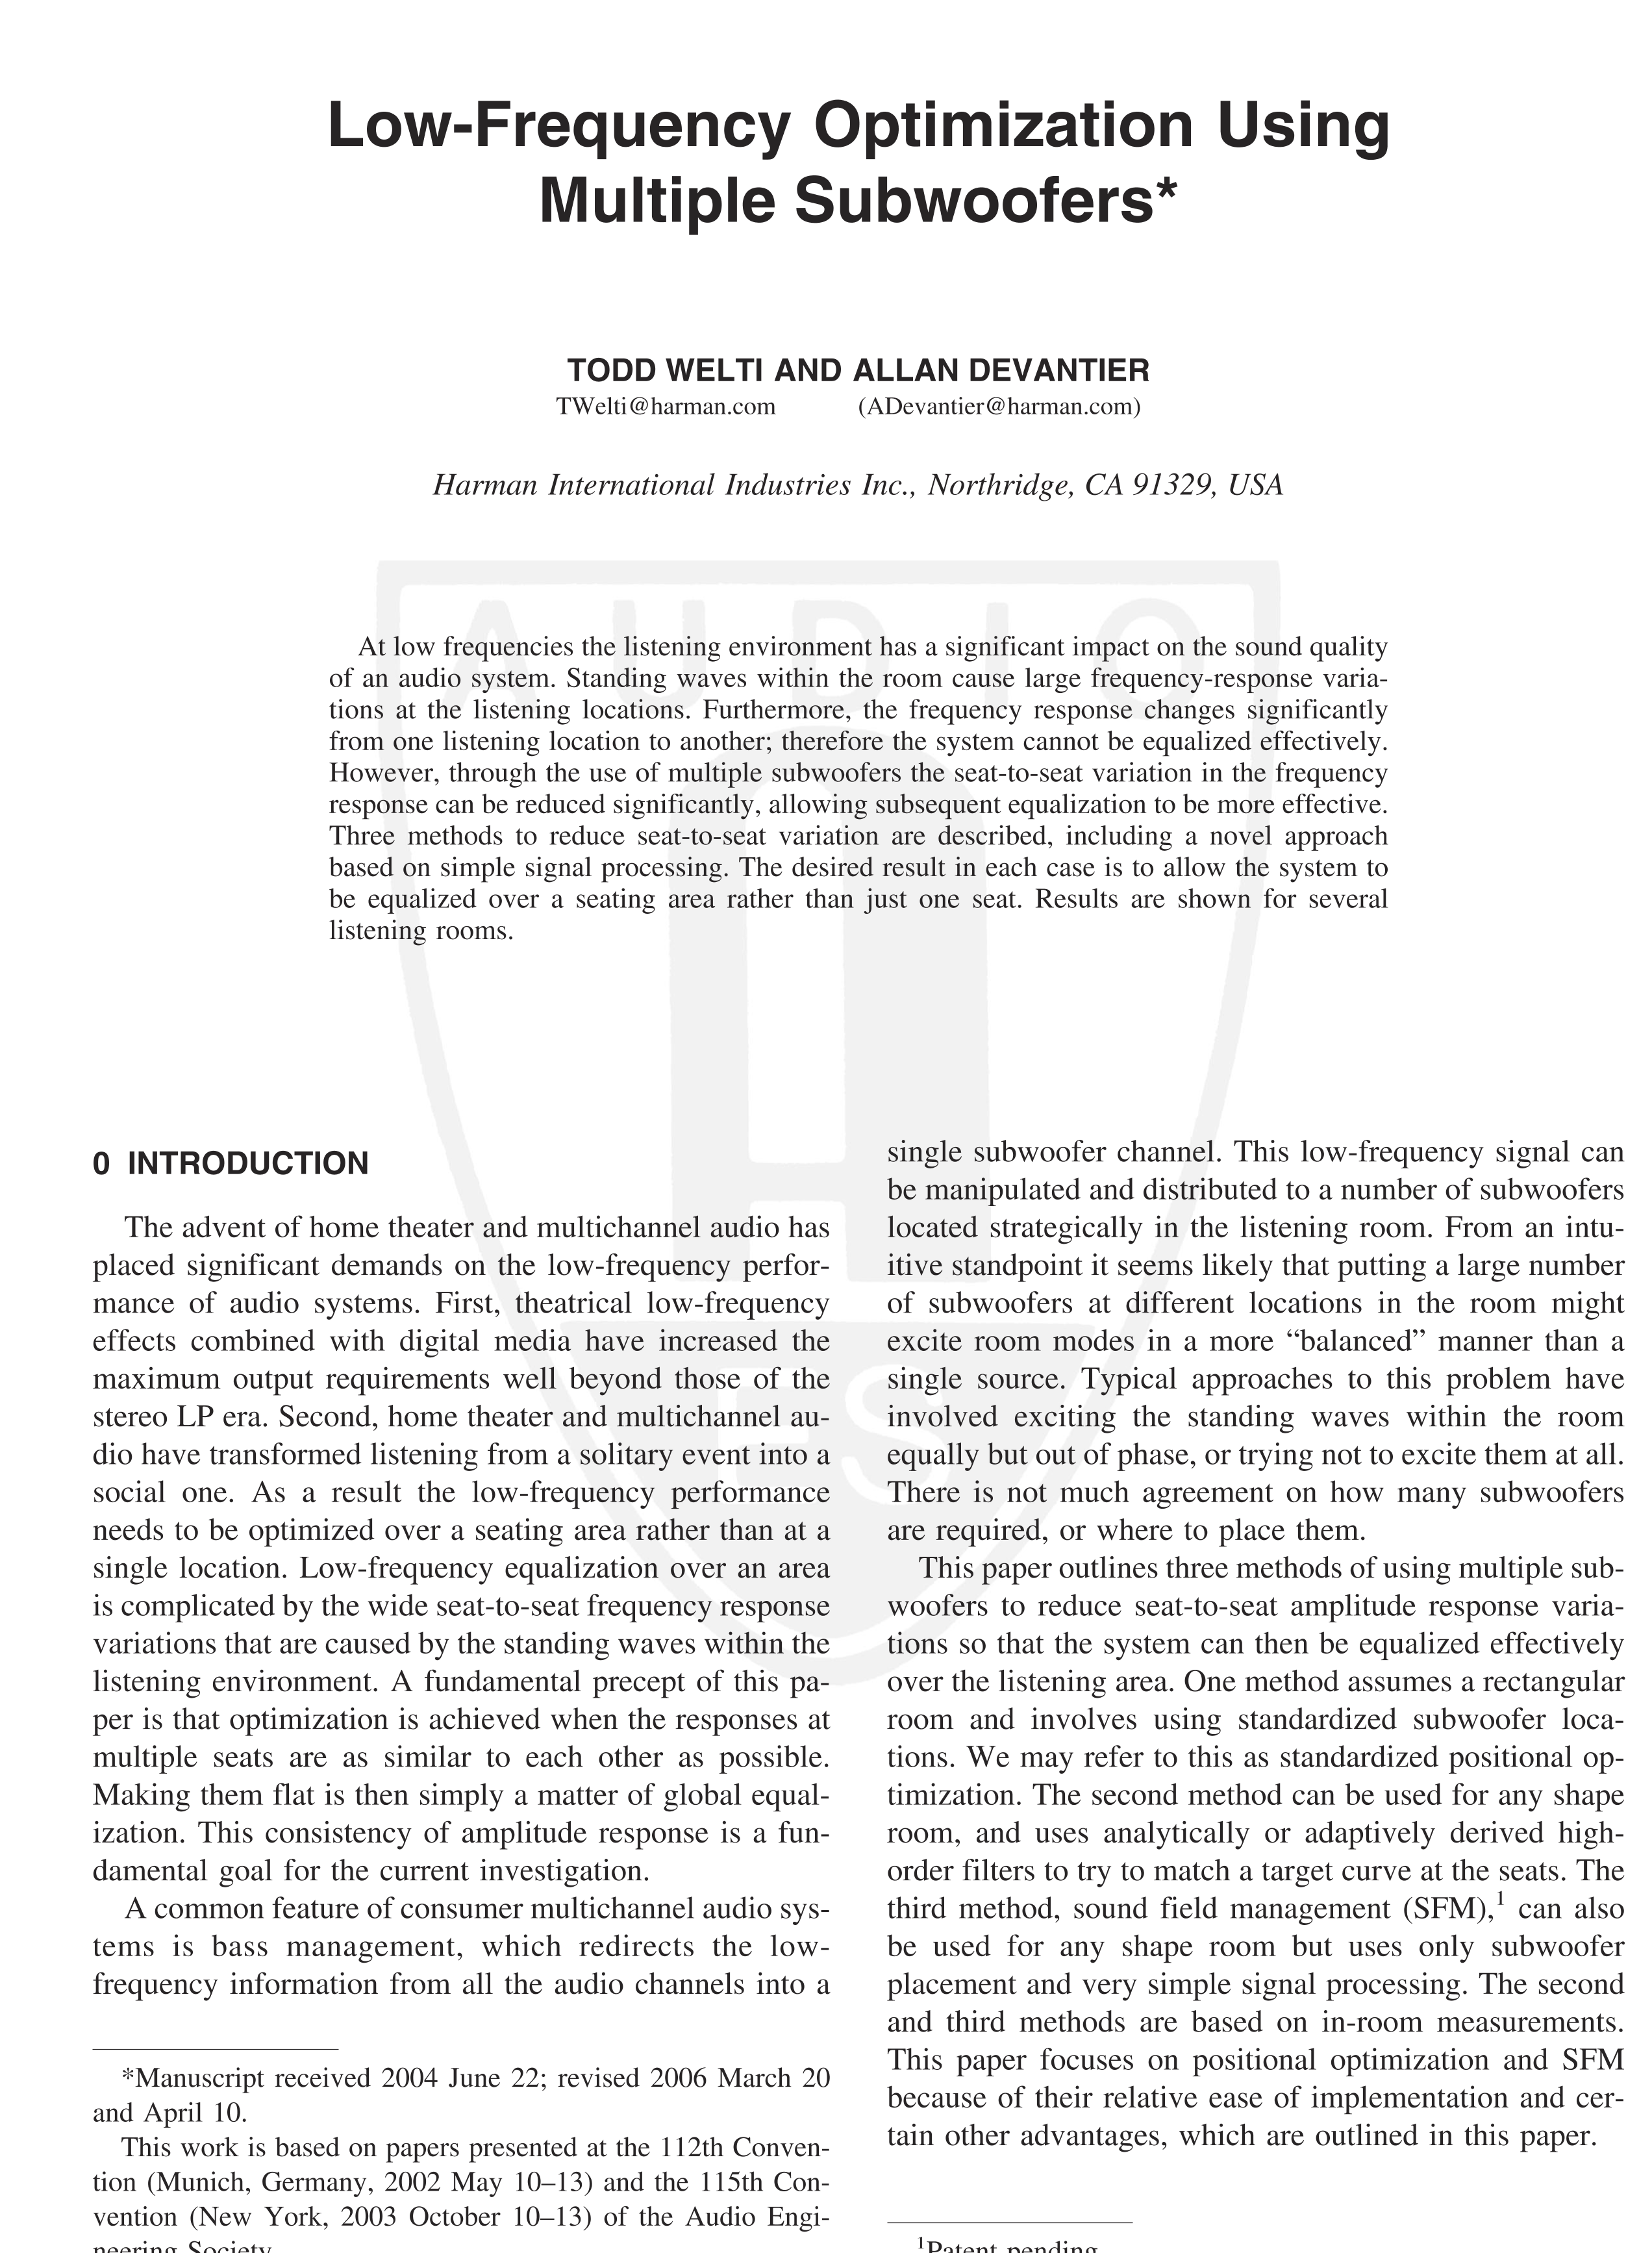
The red and green both indicate areas of maximum pressures of the room mode, but with opposite polarities (when one is at maximum positive pressure, the other is at maximum negative pressure). White is zero pressure, which indicates areas of the room mode nulls.
The room modes, however, can only give information regarding the reverberant sound responses. The direct sound from the source is not considered. I ran a series of full room response simulations to help show the differences. I used a simple rectangular room (5 m wide x 4 m long x 2.44 m high). To cross check the accuracy of the calculated room mode frequencies, the calculated mode frequencies matched those using
Amroc at Amcoustic.

Let's look at two of the modes - 54.91 Hz and 80.90 Hz. This is an enlarged plot of the 54.91 Hz mode. I normalized the totally sub output power to be the same in all simulation runs, i.e., if there is 1 sub, the output is set to 1 (arbitrary unit). For 2 subs, output of each is set to 1/2, and etc. All room boundaries (walls, ceiling and floor) are modeled with a uniform absorption coefficient of 0.2.
 1 Sub
1 Sub
All room modes peak at the room corners (when 3 perpendicular walls intersect). This is with the sub placed at a room corner. The room mode shape is recognizable from the response plot but the null is shifted away from the sub after summing with the direct sound response.

The 2 cases are place at mid-length nulls along the 2 walls. Placing the sub at nulls give weaker averaged room SPL. Also, the room mode is not excited when the sub is located at the null, and the room mode pattern is not noticeable in the response plot.

 2 Subs
This is the response of placing the a sub at each end of the long wall. Since the modes at the corners of the long wall are of opposite polarity, a significant portion of the sub outputs cancel each other.

This is the plot of the 2 subs placed at mid-length along the short wall, where there are room mode nulls. The nulls cause low sound level in larger areas in the room (outside of the room center) than in the 1 sub case.

The graph shows the subs at diagonal corners, where the room modes have the same polarity. In this case, the response pattern follows the room mode.
 4 Subs
This is the response plot for a sub at each room corner. Since 2 of the 4 subs are placed at room mode peaks at one polarity, and the other 2 are place at opposite polarity, they largely cancel each other and result in a low average sound pressure response.

When all 4 subs placed at the nulls at the mid-length of the walls, they effectively cancel each other and the average room response is the lowest of all 8 cases.

Here are the enlarged view of the 80.90 Hz room mode, and the room responses for the same cases as above. The most notable difference is that the mid-length on the long wall is a mode peak instead of a null (and you can see the effect in the 3rd response plot).


The "high level" conclusion is that in-room bass response optimization is complicated, and the room mode plots, while they can be informative, only tell part of the story.