Headphoniness?So much for the "-honesty" in "************".
Jim

-
Welcome to ASR. There are many reviews of audio hardware and expert members to help answer your questions. Click here to have your audio equipment measured for free!
You are using an out of date browser. It may not display this or other websites correctly.
You should upgrade or use an alternative browser.
You should upgrade or use an alternative browser.
Analysis of Paper on Measurements of RCA Cables by Kunchur (Video)
- Thread starter amirm
- Start date

+1Here's my problem- I'm not an expert but have a fair grasp of his main work in solid state physics. Fourier analysis is fundamental (literally, on Day 1 of any intro course in solid state, you cover representations in k space) and he clearly understands it on a professional level.
Which leads me to conclude that he absolutely realizes this and is deliberately misleading his audience. It's not ignorance, it's dishonesty. I find this absolutely reprehensible.
Not understanding truncated sines and fourier is weird if you are a particle physicist ? Are we not talking particles as wave packets here etc ?

Article in AudioXpress https://audioxpress.com/article/hearing-and-audio-part-1-frequency-phase-and-time for admirers of Kunchur's work
P.S. This article was originally published in audioXpress, March 2024 It seems strange to repost an article after two years.
P.S. This article was originally published in audioXpress, March 2024 It seems strange to repost an article after two years.

You must be joking. No admirers here at all probably. Nyquist-Shannon theorem debunks the nonsense and actual ABX testing is missing.Article in AudioXpress https://audioxpress.com/article/hearing-and-audio-part-1-frequency-phase-and-time for admirers of Kunchur's work
Undoubtedly!You must be joking.
But there are these 30 pages of discussion)))

- Joined
- May 1, 2021
- Messages
- 509
- Likes
- 1,621
There is no particular time line for when or if the articles go online. Mine are getting online fairly quickly, although my three parter on Phase is still not up, which could probably be useful for the discussion in this thread.Article in AudioXpress https://audioxpress.com/article/hearing-and-audio-part-1-frequency-phase-and-time for admirers of Kunchur's work
P.S. This article was originally published in audioXpress, March 2024 It seems strange to repost an article after two years.
Some local audiophiles (who do not hear, do not understand, or do not wish to hear\understand—for instance, a 10+ dB first mode or 50 ms time-domain anomalies) are delighted and are pondering the mysteries that have been revealed.
Ah, I read this, thank you!no particular time line for when or if the articles go online.
Last edited:
- Joined
- May 1, 2021
- Messages
- 509
- Likes
- 1,621
Probably because it is a two parter. Published means in the magazine, so for subscribers. And some articles are then later made available for anybody to read online.This was published ("published"?) twice—on March 24 and August 26.
Some local audiophiles (who do not hear, do not understand, or do not wish to hear\understand—for instance, a 10+ dB first mode or 50 ms time-domain anomalies) are delighted and are pondering the mysteries that have been revealed.

danadam
Major Contributor
- Joined
- Jan 20, 2017
- Messages
- 1,677
- Likes
- 2,585
Hm... somehow I haven't heard these "revelations" from him yet:Article in AudioXpress https://audioxpress.com/article/hearing-and-audio-part-1-frequency-phase-and-time for admirers of Kunchur's work
The abstract of the Leshowitz's paper says:Two impulses closer than this τ will blur together. This can be expected to affect the sound quality if τ is greater than the transient resolution (TR) of our hearing. The classic experiments of B. Leshowitz [14] found TR ~ 4–10µs [15]. In analogy with the blurring of star images (Figure 4), this psychoacoustic study measured a listener’s ability to distinguish single and double pulses of the same energy as illustrated in Figure 5a.
This explains why digital audio at a 44.1kHz sampling rate (“Redbook” or CD level) is not fast enough.
So:Observers were asked to discriminate between a pair of 10‐μsec pulses and a single 20‐μsec pulse having the same total energy. The independent variable was the time, ΔT, between the two 10‐μsec pulses. The stimuli were also presented as elements in a periodic pulse train. The ΔT required for resolution of two clicks (two‐click threshold) was 10 μsec. Whereas the addition of a steady background noise produced a remarkably small change in the magnitude of the two‐click threshold, performance deteriorated markedly when the pulses were low‐pass filtered. It appears that discrimination of slight changes in the energy spectrum of the two transient signals, especially in the high‐frequency region (8000 Hz and above), underlies the ear's sensitivity to a temporal discontinuity.
"It appears that discrimination of slight changes in the energy spectrum of the two transient signals, especially in the high‐frequency region (8000 Hz and above), underlies the ear's sensitivity to a temporal discontinuity"
Arghh, that damn spectrum again!
 And, of all things, in the paper that he cites himself
 . Anyway, last time I checked Redbook didn't have problems with 8000 Hz and quite a bit above that.
I have also found another version of the abstract, with one additional sentence:
"This value [...] is about three orders smaller than the temporal separation needed to hear two clicks as distinctly separate."
So to hear the clicks as distinct they must be separated by 1 to 10 ms. That won't be a problem for Redbook either.
I would have thought the reason to do that would be to attract new subscribers. With this, the result could be the oppositePublished means in the magazine, so for subscribers. And some articles are then later made available for anybody to read online.

Last edited:
danadam
Major Contributor
- Joined
- Jan 20, 2017
- Messages
- 1,677
- Likes
- 2,585
Btw, here are 1x 20 µs and 2x 10 µs pulses at 384 kHz sampling rate and their spectrum (up to 40 kHz). I don't know exactly what they meant by "having the same total energy", so I made them with the same RMS:
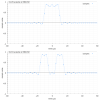 ,
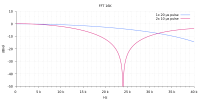
Code:
Sample peak,          RMS
 -0.98 dBFS,  -38.66 dBFS - pulse10.8x.wav
-1.07 dBFS, -38.66 dBFS - pulse20.8x.wavAttachments
Last edited:
- Joined
- May 1, 2021
- Messages
- 509
- Likes
- 1,621
Those phase vs time delay demonstrations are so weird. If one frequency is not time delayed, and another is, then sure, you would see what he plots, assuming that the system in question truly can time delay one frequency and not the other , which really points towards a length difference between two sources, so basically two systems. Because, if it is one system with one perfect delay, both frequencies would be delayed the same.
However, if there is a phase difference, then you first have to figure out if you are looking at one system or two. If you are looking at one system, and it has different phase responses for f1 and f2, then the perfect sinusoids he shows, are not correct, as there will be a transient response from both of them, both having an immediate response but also both smeared, until steady-state is achieved. That is linear distortion due to phase differences. If he is looking at two systems, then from the plots, you would really need to know if he is windowing at t=0, or when steady-state is reached. It is very odd.
And with those windows applied, there will be a lot more frequencies involved, as neither signal is now represented via a single frequency. He says that people tend to not understand phase and delay, but I am pretty sure he does not either.
After falling on the floor laughing at his backward piano "proof" that the timing is more important than FR for timbre I stopped reading. And if I ever get a DAC that plays things backwards Ill return it. Thanks for the heads up. This amateur paper would be thrown out of any respectable University,
OP

- Thread Starter
- #613
Of all people, I have heard a technical person at DIRAC say the same thing as to make "timing" important.After falling on the floor laughing at his backward piano "proof" that the timing is more important than FR for timbre I stopped reading.
- Joined
- Sep 4, 2026
- Messages
- 111
- Likes
- 144
I just watched the entire video. I am not a scientist. Never the less I found Amir's presentation overwhelmingly credible. I think it is great that the information can be presented in such a way to be understandable to the non scientist because those are the people most likely to fall for these incorrect claims. The flaws are so great that you can't help but wonder if it is intentional. Even so how in the world does the paper get published in a respected scientific journal? The publishers are so lame that they can't spot these glaring errors? Really unbelievable. Great job Amir. Have a nice day.
OP
- Thread Starter
- #615
The thing about AES is that while the "E" stands for Engineering, it does NOT mean electrical engineering. In Pro audio world, the person mixing and mastering is often called "engineer." I guess to contrast with the artist that is not. While there are highly technical people there with proper engineering degree, they are not the majority. Nor are they used on purpose to review such papers. For the Pro audio "engineers," all the fancy words used in this type of paper is enough to consider it authoritative enough to pass.Even so how in the world does the paper get published in a respected scientific journal?
Note that even in other fora where subject matter experts perform peer review, it is NOT their job to say the research is or is not correct. They only assess if basics of how the work is describe is correct. The reviewers had no ability or obligation to confirm the results.
Even so, papers like this should not have gotten through. The peer review group should have flagged the paper to be beyond their expertise to evaluate and read by true experts in the field. As is, style seems to have won over substance and correctness.

Speedskater
Major Contributor
Thing is Milind N. Kunchur is a scientist with over 100 papers dealing with:
Hysteretic internal fields and critical currents in polycrystalline superconductors
* * * * * * * * * * * * *
So he is very skilled at writing an impressive snake oil paper.
Hysteretic internal fields and critical currents in polycrystalline superconductors
* * * * * * * * * * * * *
So he is very skilled at writing an impressive snake oil paper.

solderdude
Grand Contributor
The answer of the AI depends on how you asked the question and what info it found (there are lots of critical comments and lots of people fully believing it).
AI tends to create answers the one asking 'desires' and 'pleases'.
Maybe in 1 or 2 years we can see a very convincing video starring Amir who totally defends Kunchur's article .... but was completely done by AI.
So, a question could be ... will information we find on the web in the future even be trustworthy at all ?
OP
- Thread Starter
- #619
So far, Google and to some extent ChatGPT, are drawing heavily from ASR as a counterweight to nonsense anti-science and engineering spread by others. We need to continue in our mission to spread the word. After all, it is all a game of probability and statistics of what words go with what question.So, a question could be ... will information we find on the web in the future even be trustworthy at all ?
OP
- Thread Starter
- #620
So I fed ChatGPT Pro (paid) this prompt: "consider the paper published Paper on Measurements of RCA Cables by Kunchur"
It wrote back this response which was clearly influenced by my prior interactions with it:
Yes—Kunchur’s 2021 RCA-only measurement paper is the relevant one: “An Electrical Study of Single-Ended Analog Interconnect Cables.”
It removes the most obvious flaw in his AES listening paper—comparing different RCA and XLR signal paths—but it still establishes only this:
So it is fair to say: the paper shows RCA interconnects are not electrically identical; it does not demonstrate that the identified differences explain audible cable-quality differences. The paper’s own leap from microsecond behavior to audibility is especially unsupported by its measurements. iosrjournals.org
---
So I prompted again: "do that analysis, ignoring any interactions with me."
It seems to have followed that advice:
Its strongest result is: unbalanced interconnect shielding and grounding can matter for noise pickup. Its central claim—microsecond-scale capacitive/reflection behavior as a likely explanation for audible cable character—is not established.
That result is important: for the stated, representative source/load condition, the paper finds no consequential conventional audio-band transfer error.
That is incorrect reasoning.
A linear time-invariant network is defined by its impulse response/convolution: it necessarily has output dependent on prior input history. Frequency-dependent capacitance, dielectric loss, dispersion, and dielectric absorption can all be represented by a fixed linear transfer function—typically a distributed RC model or a sum of RC branches.
To establish nonlinearity, the paper would need to show that the response changes with signal amplitude: e.g., measure intermodulation, harmonic distortion, or impulse/transfer response at several voltages with carefully controlled error. It does not do that. The 5 V pulse tests show that cables behave differently at RF; they do not show relevant nonlinear signal alteration at line level.
That is real RF behavior. But it does not follow that a music signal is materially altered:
That is legitimate as a sensitivity experiment, but it is not representative of the 600 Ω/10 kΩ audio connection subsequently called typical. It can show a difference in capacitance or loss behavior; it cannot, by itself, establish a relevant effect in ordinary line-level use.
Also, the paper infers a large frequency variation in the generic cable’s capacitance from a transfer measurement in that extreme high-impedance setup. An independent impedance/complex-admittance measurement across frequency, with calibration and uncertainty, would be needed before treating the inferred change as a material property of the cable rather than the full fixture.
That is plausible and useful. Shield construction, source impedance, cable routing, ground reference, and the receiving equipment’s RF rejection absolutely can make an RCA interconnect behave differently in a given installation.
But the conclusion should be narrower than the paper’s:
A monotonic ranking across three deliberately chosen cables is not evidence that price or “audiophile grade” causes the claimed improvements. It is compatible with the simpler conclusion that these three designs differ, especially in shielding and RF behavior.
It wrote back this response which was clearly influenced by my prior interactions with it:
Yes—Kunchur’s 2021 RCA-only measurement paper is the relevant one: “An Electrical Study of Single-Ended Analog Interconnect Cables.”
It removes the most obvious flaw in his AES listening paper—comparing different RCA and XLR signal paths—but it still establishes only this:
- Different RCA cables can have measurably different noise pickup and time-domain responses.
- The reported reflection/deviation effects are driven by very-fast-edge tests, far beyond audio bandwidth.
- A measured difference is not evidence of an audible difference unless its magnitude is quantified at the receiving component under realistic source/load impedances and shown to survive an audio-bandwidth, level-matched comparison.
So it is fair to say: the paper shows RCA interconnects are not electrically identical; it does not demonstrate that the identified differences explain audible cable-quality differences. The paper’s own leap from microsecond behavior to audibility is especially unsupported by its measurements. iosrjournals.org
---
So I prompted again: "do that analysis, ignoring any interactions with me."
It seems to have followed that advice:
Bottom line
This is a useful demonstration that three particular RCA interconnects have different electrical properties, especially RF pickup. It does not demonstrate that their time-domain differences alter music audibly, nor that one is intrinsically “better” in normal audio use.Its strongest result is: unbalanced interconnect shielding and grounding can matter for noise pickup. Its central claim—microsecond-scale capacitive/reflection behavior as a likely explanation for audible cable character—is not established.
What the paper actually measures
It compares one 2 m cable each at roughly $500 (“S”), $50 (“M”), and <$5 (“G”), then measures RLC parameters, frequency response, pulse response, RF reflections, and noise pickup. The normal-audio test uses a 600 Ω source and 10 kΩ load. Under that condition, the measured frequency response is flat within ±0.03 dB and phase variation within ±0.06°—including the generic cable. iosrjournals.orgThat result is important: for the stated, representative source/load condition, the paper finds no consequential conventional audio-band transfer error.
The major technical problem: frequency-dependent capacitance is not proof of nonlinearity
The paper says that dielectric behavior means a cable “cannot be represented by a fixed transfer function” and introduces history-dependent convolution as evidence. iosrjournals.orgThat is incorrect reasoning.
A linear time-invariant network is defined by its impulse response/convolution: it necessarily has output dependent on prior input history. Frequency-dependent capacitance, dielectric loss, dispersion, and dielectric absorption can all be represented by a fixed linear transfer function—typically a distributed RC model or a sum of RC branches.
To establish nonlinearity, the paper would need to show that the response changes with signal amplitude: e.g., measure intermodulation, harmonic distortion, or impulse/transfer response at several voltages with carefully controlled error. It does not do that. The 5 V pulse tests show that cables behave differently at RF; they do not show relevant nonlinear signal alteration at line level.
Why the pulse/reflection results do not support an audio conclusion
The reflection experiment uses 4 ns pulses and a 500 MHz measurement chain. That is an RF test, deliberately examining content tens to hundreds of MHz above audio. With a 100 Ω source and a 10 kΩ load—nearly open at RF—the cable is badly mismatched as a transmission line, so reflections are expected. The paper itself identifies a ~23.8 ns reflection period consistent with the cable round-trip delay. iosrjournals.orgThat is real RF behavior. But it does not follow that a music signal is materially altered:
- Audio content does not contain 4 ns edges.
- A ~1–2 µs decay is associated principally with ultrasonic behavior; its existence alone says nothing about residual magnitude within 20 kHz.
- The paper’s own audio-band frequency-response result already constrains any linear, baseband effect.
- The relevant quantity would be the difference between cables after band-limiting to audio, referenced to program material, then tested for audibility.
The capacitance experiment is deliberately nonrepresentative
To magnify the capacitance effect, the paper uses a 1 MΩ source resistance, a 1 MΩ load, and doubles cable length to 4 m. iosrjournals.orgThat is legitimate as a sensitivity experiment, but it is not representative of the 600 Ω/10 kΩ audio connection subsequently called typical. It can show a difference in capacitance or loss behavior; it cannot, by itself, establish a relevant effect in ordinary line-level use.
Also, the paper infers a large frequency variation in the generic cable’s capacitance from a transfer measurement in that extreme high-impedance setup. An independent impedance/complex-admittance measurement across frequency, with calibration and uncertainty, would be needed before treating the inferred change as a material property of the cable rather than the full fixture.
Noise: the credible and potentially meaningful finding
The paper measures substantially different RF and audio-band noise voltages among the three cables. Its quoted ITU-R 468-weighted values are 25.3, 40.6, and 44.5 µV RMS for S, M, and G; the full 0–2.5 MHz figures for M and G are far larger because of RF pickup. iosrjournals.orgThat is plausible and useful. Shield construction, source impedance, cable routing, ground reference, and the receiving equipment’s RF rejection absolutely can make an RCA interconnect behave differently in a given installation.
But the conclusion should be narrower than the paper’s:
- The test is a cable-plus-fixture-plus-local-RF-environment result, not a universal cable ranking.
- The DSO input is 1 MΩ with 500 MHz bandwidth—not an actual preamp input and not a measurement of the receiving device’s demodulated output.
- To claim audible RF effects, one must measure the audio-band output of representative receiving electronics while the interference is present, or demonstrate audibility under controlled conditions.
- The conclusion that shielding is more important than balanced topology is not supported by this experiment. A properly implemented balanced interface rejects common-mode interference through the receiver’s CMRR; measuring one well-shielded RCA cable does not test that mechanism. iosrjournals.org
Experimental-design limitations
The “grade” conclusion is heavily confounded:| Claimed variable | Also changes between S, M, and G |
|---|---|
| Cable grade / price | dielectric, geometry, shielding, connector construction, gauge, channel spacing, shield termination |
| Direction | shield ground connection for M |
| Noise performance | test layout, local RF field, grounding, receiving impedance/bandwidth |
| Manufacturing quality | only one example of each cable class; no production sample replication |
What would make the paper persuasive
A decisive follow-up would:- Use several samples of each design and comparable cables differing in one construction variable at a time.
- Measure impedance and S-parameters over frequency with calibrated fixtures.
- Measure the actual output of representative preamps/power amps under injected, controlled RF exposure.
- Band-limit and level-match cable-difference residuals, then quantify them relative to masking thresholds.
- Run blinded listening tests on the specific, measured condition.
Similar threads
- Replies
- 28
- Views
- 3K


