
-
WANTED: Happy members who like to discuss audio and other topics related to our interest. Desire to learn and share knowledge of science required. There are many reviews of audio hardware and expert members to help answer your questions. Click here to have your audio equipment measured for free!
You are using an out of date browser. It may not display this or other websites correctly.
You should upgrade or use an alternative browser.
You should upgrade or use an alternative browser.
ErinsAudioCorner
- Thread starter hardisj
- Start date
OP
- Thread Starter
- #382
BMR to the front
Yep. I actually started the review process last night. I listened to them took some notes. Hope to start the measurement stuff at the beginning of the week.
somebodyelse
Major Contributor
- Joined
- Dec 5, 2018
- Messages
- 3,759
- Likes
- 3,066
I'd be surprised if your current laptop is really 32-bit - more likely it's a 64-bit machine with a 32-bit version of Windows installed. Do you know what the processor is? If you're lucky then the upgrade to 64-bit Windows will be free, but I think it'll need a reinstall rather than an online upgrade.Just gonna throw this out here...
I am on a beta test program for Minidsp/Dirac Live 2.0+. But the new versions of DL HAVE to have a 64-bit machine. I verified this directly (see attached).
Unfortunately, my measurement laptop that I use all my software for Klippel, REW, Dirac, etc is 32-bit. I can’t run the new DL versions on this. So great... Now just when I was kind of getting caught back up with all the funds I’ve spent on test gear I find out I need a new laptop. I’ve been looking at refurbished everything but thought I’d ask here if anyone happens to have a 64-bit laptop with windows 10 pro they would be willing to sell before I have to cough up $400+ on a refurb Dell/HP/etc.
ribosradagast
Active Member
- Joined
- Dec 2, 2019
- Messages
- 130
- Likes
- 175
... and just like that, my illusions of you looking and sounding like a young Michael Jackson were shattered
OP
- Thread Starter
- #385
... and just like that, my illusions of you looking and sounding like a young Michael Jackson were shattered
I am not sure whether to be sad or relieved...
OP
- Thread Starter
- #386
I'd be surprised if your current laptop is really 32-bit - more likely it's a 64-bit machine with a 32-bit version of Windows installed. Do you know what the processor is? If you're lucky then the upgrade to 64-bit Windows will be free, but I think it'll need a reinstall rather than an online upgrade.
I already purchased a new one and sold the old one. Such is life.
OP
- Thread Starter
- #387
Klippel released their new build along with some updated modules overnight. I am now using their latest Multitone Distortion module (MTON) with In-Situ Room Compensation (ISC) module to get *true* distortion performance in the farfield. Why is this special? Because measuring in the nearfield reduces noisefloor (reflections, mainly) but it isn't far enough to get the true speaker summation of a multi-way speaker. Meaning, in the nearfield you are biased toward one speaker or another. It's an OK way to get performance but it's not as accurate as gathering the data in the farfield.
With MTON I am able to use an IEC or CEA-2010 standard to determine the maximum SPL It takes some time to set this up but having the ability to provide a real actual max SPL based on a real standard (rather than a method that everyone disagrees with and is not accepted) is worth it in the end. Here's some discussion on one standard: https://www.klippel.de/fileadmin/klippel/Files/News/Electrical and Mechanical Measurements of Loudspeakers and Sound System Equipment.pdf
There are short signal max SPL versions as well as long-term max SPL (my favorite). There are, naturally, some caveats to the testing. Such as little bookshelf speakers are being sent 20-20kHz signal but I can alter that. I am currently re-running a test on the Neumi BS5 with an 80-20kHz signal and it's (obviously) able to take more voltage before it hits the max long-term SPL than it can with a 20-20k signal. So, I may wind up performing a dual-test in these cases. But we will see.
Either way, it took some time for Klippel to deliver the latest update but I am on top of it and already getting some excellent information from the modules.
Here's a few teaser shots. Don't read anything in to this too much as these are not from a finalized test. Just showing you what features and information is available.
OP
- Thread Starter
- #388
I also just made this short video to give you an idea of what these modules allow me to do.
First... Turn down your volume! I play a multitone signal twice in this video and it’s gonna be pretty loud.
First... Turn down your volume! I play a multitone signal twice in this video and it’s gonna be pretty loud.
OP
- Thread Starter
- #390
Could you help me a littel??
Could you descripe with some sentences how short and longterm max. spl is defiened?
i just posted a video right above your reply that I think will answer your question.
i just posted a video right above your reply that I think will answer your question.
Yes that was a cross over sry. So i watched the video and things are more clear now. But have to look again. Still not shure with long term max. spl. But hey cool stuff!
OP
- Thread Starter
- #392
Yes that was a cross over sry. So i looked the video things are more clear now. But have to look again. Still not shure with long term max. spl. But hey cool stuff!
No worries.
The module is new so I’m still reading about the different standards such as length, stimulus shaping, etc. but also permitting for some “real world” use cases as some standards are more engineering based than practicality based. Especially in my industry... but that’s a different story ...
Long term and short term have their place. You could hit a distortion threshold before compression. That would likely be shown via the short term testing. I’m thinking more like mechanical issues. I like the long term SPL testing because it’s more practical for how we listen where compression effects set in as the voice coil heats up. But again, I’m still learning my way through the module. Just wanted to share the news.
IMHO, this testing is icing on the cake of all the other measurements I provide. Some really cool stuff here.
OP
- Thread Starter
- #393
Oh, and to be clear, I was already using the previous version of ISC for my FR data. Just in case anyone was wondering.
OP
- Thread Starter
- #394
Hey, guys. Not sure if any of you have seen my other thread but I posted last week about wanting to get a pair of the Bose 901 speakers to test here.
A member of this forum offered up a pair of Bose 901 Series V speakers to me to test. I will let him decide if he wants to say who he is. I told him I would take care of shipping costs both ways. Well, he shipped them today and the total was $115. One-way. So, probably another $115 back to him. Eek!
If anyone here is interested in this data enough and can help me offset some of the shipping costs by donating a little bit, it would be greatly appreciated. You can do so via PayPal through my site link here:
https://www.erinsaudiocorner.com/contribute/
Last edited:
- Joined
- Jan 23, 2020
- Messages
- 4,336
- Likes
- 6,705
Klippel released their new build along with some updated modules overnight. I am now using their latest Multitone Distortion module (MTON) with In-Situ Room Compensation (ISC) module to get *true* distortion performance in the farfield. Why is this special? Because measuring in the nearfield reduces noisefloor (reflections, mainly) but it isn't far enough to get the true speaker summation of a multi-way speaker. Meaning, in the nearfield you are biased toward one speaker or another. It's an OK way to get performance but it's not as accurate as gathering the data in the farfield.
With MTON I am able to use an IEC or CEA-2010 standard to determine the maximum SPL It takes some time to set this up but having the ability to provide a real actual max SPL based on a real standard (rather than a method that everyone disagrees with and is not accepted) is worth it in the end. Here's some discussion on one standard: https://www.klippel.de/fileadmin/klippel/Files/News/Electrical and Mechanical Measurements of Loudspeakers and Sound System Equipment.pdf
There are short signal max SPL versions as well as long-term max SPL (my favorite). There are, naturally, some caveats to the testing. Such as little bookshelf speakers are being sent 20-20kHz signal but I can alter that. I am currently re-running a test on the Neumi BS5 with an 80-20kHz signal and it's (obviously) able to take more voltage before it hits the max long-term SPL than it can with a 20-20k signal. So, I may wind up performing a dual-test in these cases. But we will see.
Either way, it took some time for Klippel to deliver the latest update but I am on top of it and already getting some excellent information from the modules.
Here's a few teaser shots. Don't read anything in to this too much as these are not from a finalized test. Just showing you what features and information is available.
View attachment 73439
View attachment 73440
View attachment 73451
This is wonderful. This, imo, is the main missing link outside of what Amir provides that is needed to really characterize and rank speakers. A 6.5 Olive score speaker is still a bad speaker(for me) if it craps out at 90db.
- Joined
- Jan 23, 2020
- Messages
- 4,336
- Likes
- 6,705
Hey, guys. Not sure if any of you have seen my other thread but I posted last week about wanting to get a pair of the Bose 901 speakers to test here.
A member of this forum offered up a pair of Bose 901 Series V speakers to me to test. I will let him decide if he wants to say who he is. I told him I would take care of shipping costs both ways. Well, he shipped them today and the total was $115. One-way. So, probably another $115 back to him. Eek!
If anyone here is interested in this data enough and can help me offset some of the shipping costs by donating a little bit, it would be greatly appreciated. You can do so via PayPal through my site link here:
https://www.erinsaudiocorner.com/contribute/
Not sure how much an anechoic measurement protocol can tell us about a speaker for which the room is part of the speaker, but I'm still really interested to see how it turns out.
OP
- Thread Starter
- #397
This is wonderful. This, imo, is the main missing link outside of what Amir provides that is needed to really characterize and rank speakers. A 6.5 Olive score speaker is still a bad speaker(for me) if it craps out at 90db.
Agreed. I tend to listen at 90dB even at 11.5 feet. And when a speaker can’t comfortably play at least that level then I wouldn’t buy it for my main listening room. That is why I have been trying to relay the max SPL at my listening position for my subjective evaluation in my reviews. But having some objective data to back that up, or at least directly compare, is very nice.
OP
- Thread Starter
- #398
Not sure how much an anechoic measurement protocol can tell us about a speaker for which the room is part of the speaker, but I'm still really interested to see how it turns out.
Yep. Like I mentioned in the other thread, I’m interested to see what the early reflection breakout curves look like.
- Joined
- Jan 23, 2020
- Messages
- 4,336
- Likes
- 6,705
OP
- Thread Starter
- #400
I mentioned in one of the more recent posts that Klippel recently updated the build version and with that came the new versions of their ISC & MTON modules. You can read more about what these are above or watch the video. The net effect, however, is thanks to these two modules I am now able to gather accurate distortion data in the farfield as an anechoic measurement.
There are numerous templates available in the MTON module (you can read about them if you have access to the IEC standard referenced on their product page; I do not have this nor the $350 to buy it). I played with each yesterday (at least, the ones that made sense for a passive loudspeaker) and prefer the "Long Term max SPL" test. This was the one shown in the above video. I haven't decided *for sure* that this is how the tests will all be conducted going forward but, for now, I am going to share the results of the testing because it truly is next level analysis.
The DUT is the Neumi BS5. Here's the link to the review:
https://www.audiosciencereview.com/forum/index.php?threads/neumi-bs5-bookshelf-speaker-review.14404/
I ran this test twice:
First from 20Hz to 20kHz.
Second from 80Hz to 20kHz.
Voltage stepped in 1V increments set up from 1V to 30V.
In this "long term spl max" testing the compression limit was set to 3dB and the maximum distortion level was set to -20dB (relative to the fundamental), equaling about 10% distortion.
First Test: Stimulus from 20Hz to 20kHz.
I'll provide the graphics with a short explanation of what each means.
This table shows the max distortion test results. The top line tells me that the DUT hit max SPL due to hitting maximum compression.
The second block tells me what the maximum SPL value is (relative to 1 meter). In this case, the max SPL ~ 82dB.
This block also tells you the compression at this SPL (4.68dB) and the max multitone distortion (-29.62dB; ~3%).

Knowing there are two limits set for Multitone distortion failure (compression and/or distortion, mentioned above), let's break the results down in to those sections.
1) First, compression-oriented results:
The below graphic shows the stepped voltages. The 1V line (solid blue) is the reference to which all other measurements are compared. The dashed blue line is the compression limit relative to the 1V output; which is -3dB from the reference. The red line is the case that exceeded whatever threshold (compression and/or distortion as described above). This will always be the case. Red will always be the final measurement. As you will see below, if multiple voltages had passed there would be additional lines besides the reference (solid blue) and the failed (red). In this case you can see the measurement exceeded the -3dB compression limit at approximately 20Hz (noted in orange below).

Now, this is the same thing as above, but simply "normalized" to the 1V reference measurement. I prefer this version as it's easier to identify the failure modes more quickly.

And, finally, this graphic just gives you the voltage vs compression. I don't find it particularly useful. Single points of data tell me nothing I want to know. So don't be surprised if you never see this from me again:

2) Now let's look at the distortion-based results of this multitone testing...
Below are the results of the various voltages' distortion, relative to the fundamental. There will be n-1 gray lines (where n=# of voltages ran in the test; in this case, 2-1 = 1). The green will always be the last measurement. The dashed blue line at -20dB represents the multitone distortion threshold. This is set up in the template so apparently is the IEC standard. I can change it if I want to. Not sure I will. TBD.
As you can see, none of the voltages increased above the -20dB MTON threshold. Which we expected, as the table I provided first told you that compression as the cause for max SPL being reached. Noteworthy here is the 1V measurement shows a higher distortion value below about 100Hz. This is likely an effect of noise floor. I imagine most every case I run will have a similar result with very low voltage (where the signal isn't strong enough to drown out any external noise because testing is done in my garage), however, the noise will almost always be below the -20dB threshold and increasing the voltage lowers the noise floor. But I need to check with the folks at Klippel to see if that logic flows. Anyway...

This graphic provides voltage vs relative distortion. I'll probably never post this again; single points of data are useless to me.

Alright. Those are the two components for determining max SPL. Again, you can see that the -3dB set for compression threshold failure is exceeded at 20Hz and therefore the (at least in this case) cause for SPL maximum of 81.93dB.
But, given that I think it's hardly fair to expect a small bookshelf like this Neumi BS5 to realistically play down to 20Hz, I ran a separate test with the stimulus spectrum set only from 80Hz to 20kHz to see what the maximum SPL might be closer to in a real-world situation. Note: as of this moment, I do not know a way to apply a shaped stimulus to emulate a nth-order filter. So for now, this "brickwall" of 80Hz will have to suffice.
-------------- (break) --------------------
Second Test: Stimulus from 80Hz to 20kHz.
Now, let's see what the results look like using a limited, more realistic for a bookshelf speaker, stimulus of 80Hz to 20kHz.
So, that's it. This test method isn't cemented just yet. I'm going to explore the other modules and shaping stimulus when I have time. But, it gives you an idea of where I am going. Overall, I think this is fantastic news as it gives me a repeatable, highly accurate way to determine the actual maximum SPL based on a set of conditions that make sense for the average user.
With this limited stimulus the result of max SPL testing is:

Whoa! Now we have a maximum SPL of 95.65dB with compression at 3.37dB. The Multitone distortion at this output level is -40.13dB (1%).
That's a big, big difference from the 20-20kHz test results.
What are the corresponding results?...
Well, the -3dB compression limit was reached at about 1.37kHz. But barely.

How barely? By about 0.37dB.

And here is the graphic I said I wouldn't show again. Maybe I'm softening. At any rate, this one shows the max compression value relative to voltage input. Note how the curve is not linear (isn't that an oxymoron?... meh, you know what I mean).

So, how does the distortion look, then? Well, the -20dB limit is never reached. But, if I were to change this -20dB (10%) to 3% (-30dB) it still wouldn't have been exceeded with this limited stimulus at the compression limit voltage of 9V.

There you have it. Using a limited stimulus allows a higher SPL. Makes sense. But, most importantly, we have a repeatable, accurate method for determining maximum SPL with the underlying factors for why the SPL is limited to x dB. Pretty awesome.
---------- (break) ------------
Additional stuff:
To me, it's interesting to compare the overlapping voltages' distortion and compression profiles. So, let's do that. Remember, with the full 20-20k spectrum I was only able to provide a 2V input before reaching the max SPL. That's where Test 1 and Test 2 will overlap, then. So, let's directly compare what the MTON distortion and compression curves look like using 2V (I could have used 1V as well but I'm trying to save some time here):
First, this assumes 1V (reference) measurement is the same, so let's look at that by way of looking at the two compression limits (blue for the 20-20k and green for the 80-20k):

Hey, they are almost identical. Good enough for me to continue on...
Now, let's keep these compression limits but also add the 2V comparison between the full stimulus (red) vs the limited stimulus (gray). Remember, the former failed at 2V due to exceeding the threshold at 20Hz while the latter failed at ~1.37kHz. Still, how much does the limiting of excursion on the 5-inch woofer drive a change in the compression profile?...

Not a lot of difference here. A couple dB here and there. But not much; and they both only seem to deviate where the 1V (reference) for each respective measurement lies. Okay.
Moving on, let's compare the MTON distortion profiles using the same voltages. Green = Full spectrum (20-20kHz) and gray = 80-20kHz).

Interesting. The limited signal result is between 5-10dB lower in distortion until you get to about 2kHz. This shows that the woofer playing low is causing additional distortion throughout the mid/woofer's passband.
But, even beyond that, above 5kHz there is a pretty drastic difference as well with some portions reaching 10dB more distortion :
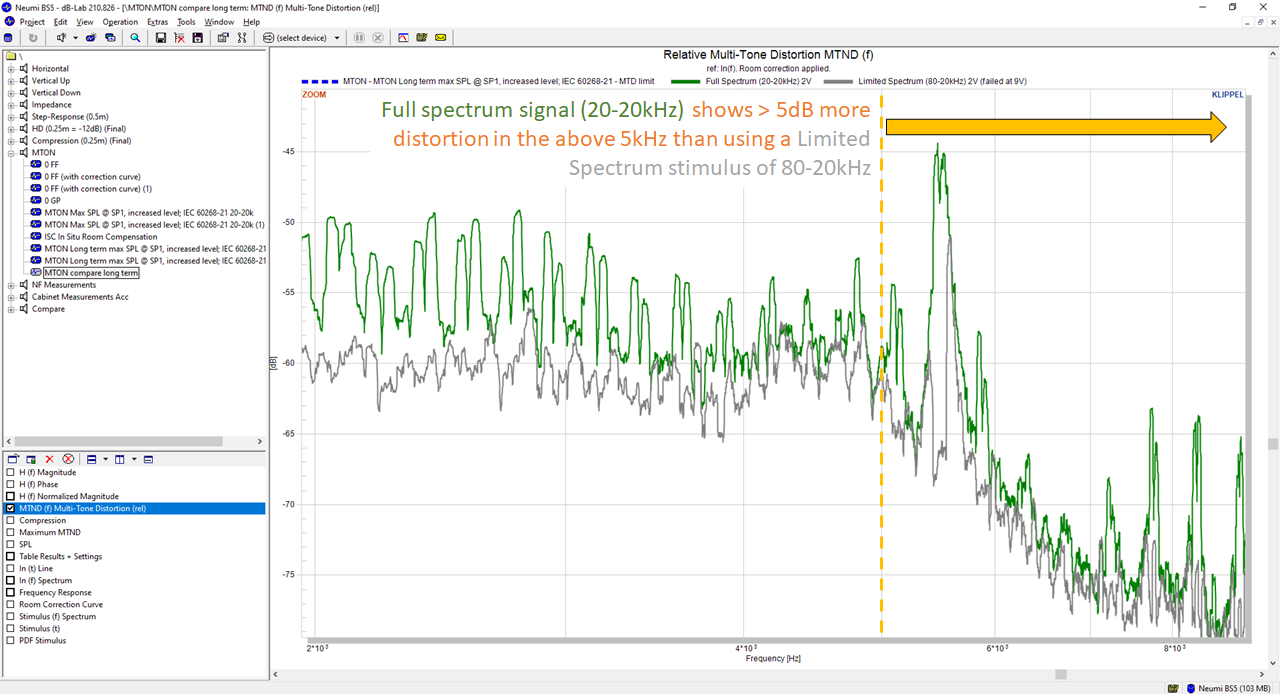
So, what can we learn here? Well, things we either already knew or would have logically assumed: a multitone signal is more dense and therefore more stressing than a single tone stimulus like a harmonic distortion or even a two-tone stimulus like an IMD test. This is a good way to resolve complex distortion drivers that wouldn't otherwise be shown. Notably at points far away from the loudspeaker's drive unit's individual Fs (where, typically, suspension related distortion is prominent). However, I didn't expect the difference in distortion to be so significant as high in frequency (even out to 20kHz) by simply limiting the stimulus above 80Hz. That was really eye-opening.
...... aaaaaaaaaaand... done.
Once I settle in on a test method I'll figure out if I want to use Klippel's default window for providing results or write my own script. In this case, though, I think I like theirs just fine. In other cases it made more sense to write my own. That was a topic of conversation in our hour-long skype session a couple weeks ago. They asked for feedback on their graphics (they noticed I was using the data but writing my own scripts for plotting). It looks like some of my suggestions may have already been incorporated. I'll be beta testing their next major release for next year and I'm excited to see what they have changed with their GUI.
There are numerous templates available in the MTON module (you can read about them if you have access to the IEC standard referenced on their product page; I do not have this nor the $350 to buy it
). I played with each yesterday (at least, the ones that made sense for a passive loudspeaker) and prefer the "Long Term max SPL" test. This was the one shown in the above video. I haven't decided *for sure* that this is how the tests will all be conducted going forward but, for now, I am going to share the results of the testing because it truly is next level analysis.The DUT is the Neumi BS5. Here's the link to the review:
https://www.audiosciencereview.com/forum/index.php?threads/neumi-bs5-bookshelf-speaker-review.14404/
I ran this test twice:
First from 20Hz to 20kHz.
Second from 80Hz to 20kHz.
Voltage stepped in 1V increments set up from 1V to 30V.
In this "long term spl max" testing the compression limit was set to 3dB and the maximum distortion level was set to -20dB (relative to the fundamental), equaling about 10% distortion.
First Test: Stimulus from 20Hz to 20kHz.
I'll provide the graphics with a short explanation of what each means.
This table shows the max distortion test results. The top line tells me that the DUT hit max SPL due to hitting maximum compression.
The second block tells me what the maximum SPL value is (relative to 1 meter). In this case, the max SPL ~ 82dB.
This block also tells you the compression at this SPL (4.68dB) and the max multitone distortion (-29.62dB; ~3%).
Knowing there are two limits set for Multitone distortion failure (compression and/or distortion, mentioned above), let's break the results down in to those sections.
1) First, compression-oriented results:
The below graphic shows the stepped voltages. The 1V line (solid blue) is the reference to which all other measurements are compared. The dashed blue line is the compression limit relative to the 1V output; which is -3dB from the reference. The red line is the case that exceeded whatever threshold (compression and/or distortion as described above). This will always be the case. Red will always be the final measurement. As you will see below, if multiple voltages had passed there would be additional lines besides the reference (solid blue) and the failed (red). In this case you can see the measurement exceeded the -3dB compression limit at approximately 20Hz (noted in orange below).
Now, this is the same thing as above, but simply "normalized" to the 1V reference measurement. I prefer this version as it's easier to identify the failure modes more quickly.
And, finally, this graphic just gives you the voltage vs compression. I don't find it particularly useful. Single points of data tell me nothing I want to know. So don't be surprised if you never see this from me again:
2) Now let's look at the distortion-based results of this multitone testing...
Below are the results of the various voltages' distortion, relative to the fundamental. There will be n-1 gray lines (where n=# of voltages ran in the test; in this case, 2-1 = 1). The green will always be the last measurement. The dashed blue line at -20dB represents the multitone distortion threshold. This is set up in the template so apparently is the IEC standard. I can change it if I want to. Not sure I will. TBD.
As you can see, none of the voltages increased above the -20dB MTON threshold. Which we expected, as the table I provided first told you that compression as the cause for max SPL being reached. Noteworthy here is the 1V measurement shows a higher distortion value below about 100Hz. This is likely an effect of noise floor. I imagine most every case I run will have a similar result with very low voltage (where the signal isn't strong enough to drown out any external noise because testing is done in my garage), however, the noise will almost always be below the -20dB threshold and increasing the voltage lowers the noise floor. But I need to check with the folks at Klippel to see if that logic flows. Anyway...
This graphic provides voltage vs relative distortion. I'll probably never post this again; single points of data are useless to me.
Alright. Those are the two components for determining max SPL. Again, you can see that the -3dB set for compression threshold failure is exceeded at 20Hz and therefore the (at least in this case) cause for SPL maximum of 81.93dB.
But, given that I think it's hardly fair to expect a small bookshelf like this Neumi BS5 to realistically play down to 20Hz, I ran a separate test with the stimulus spectrum set only from 80Hz to 20kHz to see what the maximum SPL might be closer to in a real-world situation. Note: as of this moment, I do not know a way to apply a shaped stimulus to emulate a nth-order filter. So for now, this "brickwall" of 80Hz will have to suffice.
-------------- (break) --------------------
Second Test: Stimulus from 80Hz to 20kHz.
Now, let's see what the results look like using a limited, more realistic for a bookshelf speaker, stimulus of 80Hz to 20kHz.
So, that's it. This test method isn't cemented just yet. I'm going to explore the other modules and shaping stimulus when I have time. But, it gives you an idea of where I am going. Overall, I think this is fantastic news as it gives me a repeatable, highly accurate way to determine the actual maximum SPL based on a set of conditions that make sense for the average user.
With this limited stimulus the result of max SPL testing is:
Whoa! Now we have a maximum SPL of 95.65dB with compression at 3.37dB. The Multitone distortion at this output level is -40.13dB (1%).
That's a big, big difference from the 20-20kHz test results.
What are the corresponding results?...
Well, the -3dB compression limit was reached at about 1.37kHz. But barely.
How barely? By about 0.37dB.
And here is the graphic I said I wouldn't show again. Maybe I'm softening. At any rate, this one shows the max compression value relative to voltage input. Note how the curve is not linear (isn't that an oxymoron?... meh, you know what I mean).
So, how does the distortion look, then? Well, the -20dB limit is never reached. But, if I were to change this -20dB (10%) to 3% (-30dB) it still wouldn't have been exceeded with this limited stimulus at the compression limit voltage of 9V.
There you have it. Using a limited stimulus allows a higher SPL. Makes sense. But, most importantly, we have a repeatable, accurate method for determining maximum SPL with the underlying factors for why the SPL is limited to x dB. Pretty awesome.
---------- (break) ------------
Additional stuff:
To me, it's interesting to compare the overlapping voltages' distortion and compression profiles. So, let's do that. Remember, with the full 20-20k spectrum I was only able to provide a 2V input before reaching the max SPL. That's where Test 1 and Test 2 will overlap, then. So, let's directly compare what the MTON distortion and compression curves look like using 2V (I could have used 1V as well but I'm trying to save some time here):
First, this assumes 1V (reference) measurement is the same, so let's look at that by way of looking at the two compression limits (blue for the 20-20k and green for the 80-20k):
Hey, they are almost identical. Good enough for me to continue on...
Now, let's keep these compression limits but also add the 2V comparison between the full stimulus (red) vs the limited stimulus (gray). Remember, the former failed at 2V due to exceeding the threshold at 20Hz while the latter failed at ~1.37kHz. Still, how much does the limiting of excursion on the 5-inch woofer drive a change in the compression profile?...
Not a lot of difference here. A couple dB here and there. But not much; and they both only seem to deviate where the 1V (reference) for each respective measurement lies. Okay.
Moving on, let's compare the MTON distortion profiles using the same voltages. Green = Full spectrum (20-20kHz) and gray = 80-20kHz).
Interesting. The limited signal result is between 5-10dB lower in distortion until you get to about 2kHz. This shows that the woofer playing low is causing additional distortion throughout the mid/woofer's passband.
But, even beyond that, above 5kHz there is a pretty drastic difference as well with some portions reaching 10dB more distortion :
So, what can we learn here? Well, things we either already knew or would have logically assumed: a multitone signal is more dense and therefore more stressing than a single tone stimulus like a harmonic distortion or even a two-tone stimulus like an IMD test. This is a good way to resolve complex distortion drivers that wouldn't otherwise be shown. Notably at points far away from the loudspeaker's drive unit's individual Fs (where, typically, suspension related distortion is prominent). However, I didn't expect the difference in distortion to be so significant as high in frequency (even out to 20kHz) by simply limiting the stimulus above 80Hz. That was really eye-opening.
...... aaaaaaaaaaand... done.
Once I settle in on a test method I'll figure out if I want to use Klippel's default window for providing results or write my own script. In this case, though, I think I like theirs just fine. In other cases it made more sense to write my own. That was a topic of conversation in our hour-long skype session a couple weeks ago. They asked for feedback on their graphics (they noticed I was using the data but writing my own scripts for plotting). It looks like some of my suggestions may have already been incorporated. I'll be beta testing their next major release for next year and I'm excited to see what they have changed with their GUI.
Attachments
Last edited:
Similar threads
- Replies
- 18
- Views
- 1K
- Replies
- 29
- Views
- 4K
- Replies
- 25
- Views
- 1K
- Replies
- 17
- Views
- 2K