FINALLY!!!!! I have finally completed my review of the Buchardt S400. I have spent countless hours on this, as you probably know by me posting my progress of everything over the last couple months.
https://www.erinsaudiocorner.com/loudspeakers/buchardt_audio_s400_bookshelf/
One thing I have done differently from what I've seen is my polar spectrograms. We typically see spectrograms for a speaker "linearized" in to a rectangular shape. I was thinking, it would be neat to actually represent the data the way it comes from the speaker; in a 360° manner. Or occasionally we will see a polar plot with a single line representing a frequency, maybe with a few lines to represent multiple frequencies overlaid. But nothing that is really intuitive. So, I created these new polar plots for horizontal and vertical spl mapping of the speaker's radiation pattern both vertically and horizontally. Two versions of each. One is absolute output and the other is relative to the 0 degree axis. Not sure if anyone here will appreciate it as much as I am proud of it. And I'm sure someone will have something to say about how they prefer a different color or whatever... but dangit, I'm proud and I'm leaving it as is because it looks good to me. I think it's a better way of viewing the data. Some may not prefer it. But that's why I've offered the standard versions as well. Anyway, make sure to use the legend in the top left to get your bearings on the speaker direction relative to the radiation pattern.
I plan to make a video review but that's gonna be a bit. I need a break. For now, this written review will have to do.
I hope you guys get as much out of this as I have put in to it. I need a friggin' break now...

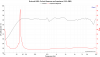
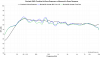
") ... also notice in VituixCAD one gets wide graphs as below when the used chart is doubleclicked and fill up the screen and think the ratio is W=100%/H=50%, where if one "Copy image" when all the six-pack of graphs is vissible then the ratio is changed to bit more detail ala ScanSpeak brochures with W=100%/H=80%.
... also notice in VituixCAD one gets wide graphs as below when the used chart is doubleclicked and fill up the screen and think the ratio is W=100%/H=50%, where if one "Copy image" when all the six-pack of graphs is vissible then the ratio is changed to bit more detail ala ScanSpeak brochures with W=100%/H=80%.