
-
WANTED: Happy members who like to discuss audio and other topics related to our interest. Desire to learn and share knowledge of science required. There are many reviews of audio hardware and expert members to help answer your questions. Click here to have your audio equipment measured for free!
You are using an out of date browser. It may not display this or other websites correctly.
You should upgrade or use an alternative browser.
You should upgrade or use an alternative browser.
Announcement: ASR Will Be Measuring Speakers!
- Thread starter amirm
- Start date
Nango
Major Contributor
Specially JBL Vintage vs newer JBL ...... Who of us hasn't had at any time at home one pair of JBL Control One (with or without "1C") ??cant wait to see measurements of jbl speakers
Last edited:
amazing news !!Thanks
Incredible AMIR, you and ASR really incredible , really well done.
Keith
Keith
Cahudson42
Major Contributor
- Joined
- Sep 21, 2019
- Messages
- 1,083
- Likes
- 1,557
And the flat panel DIY styrofoam insulation board speakers with Parts Express contact transducers - don't forget those! ")
Mr. Olinad
Member
2020 is going to be great!!!
I hope to see some desktop speakers tested, like Vanatoo T0.
I hope to see some desktop speakers tested, like Vanatoo T0.
- Joined
- Jul 24, 2018
- Messages
- 285
- Likes
- 356
In for a penny, in for a pound, eh?
What an amazing project!
What an amazing project!
How does this system rank in terms of accuracy?
For instance:
• Stereophile uses quasi-anechoic which is only valid above ~350Hz, and is plotted using connect the dots (meaning actual measurement points across the band, not measuring all frequencies).
• SoundStage/NRC are anechoic and are actual sweep measurements, but only valid above ~100Hz due to small chamber size.
Are these measurements equivalent to an anechoic chamber and is fully equivalent across the audible band?
Last edited:
OP
- Thread Starter
- #50
Nearly 6 foot tall although that may be a bit dicey relative to ceiling height. Depth can be a couple of feet or even larger but requires modification to the hardware setup. Getting speakers up on the stand and safe will be challenging. So I say in the short to medium term, we should opt for lighter, more manageable sizes.When you get a chance, it would be great to know the maximum dimensions the system can deal with.
CHEERS AMIR!!
You can see some sort of scale here of what can be managed:
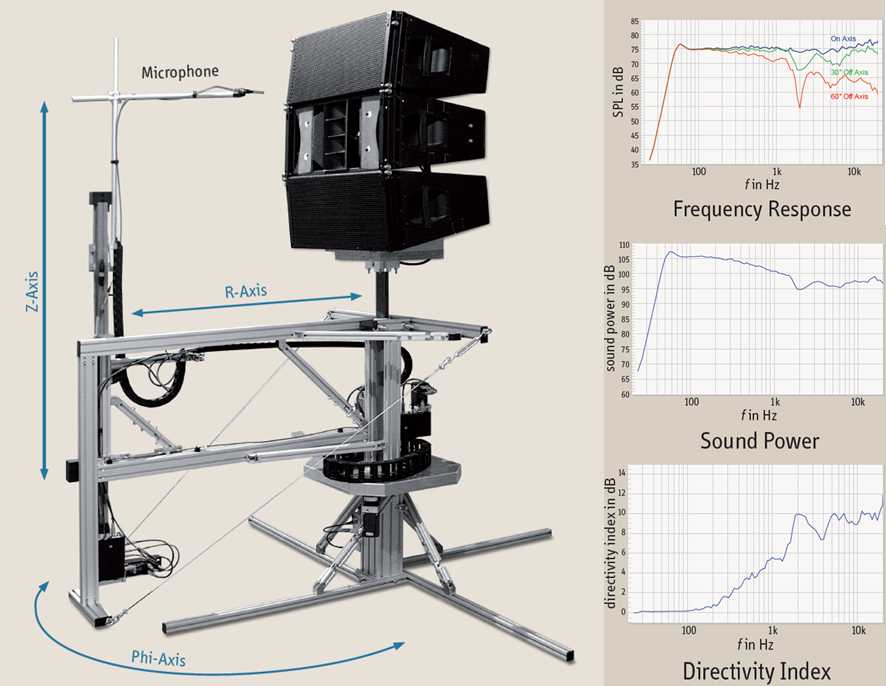
By the way, the system also measures subs and I hope to test those as well.
- Joined
- Oct 18, 2019
- Messages
- 72
- Likes
- 114
Great news! This is my cue to become a patreon. the spinorama graphs are great. I would also like something like earl geddes polar maps. Horizontal and vertical. Distortion is in my opinion less important but could be interesting as a max SPL number at 10% or something like that.
OP
- Thread Starter
- #52
It completely solves those problems. Indeed the system is sold to even be used in anechoic chambers to fix its issues!How does this system rank in terms of accuracy?
For instance:
• Stereophile uses quasi-anechoic which is only valid above ~350Hz, and is plotted using connect the dots (meaning actual measurement points across the band, not measuring all frequencies.
• Soundstage/NRC are anechoic and are actual sweep measurements, but only valid above ~100Hz due to small chamber size.
Are these measurements equivalent to an anechoic chamber and is fully equivalent across the audible band?
Stereophile uses gated measurements which has the limit you mention. The Klippel system uses that (but at higher frequency to be on the safe side) and then uses the field expansion to generate anechoic data down to 20Hz:
And with respect to SoundStage's small anechoic chamber:
OP
- Thread Starter
- #54
And oh, the system has other applications such as in cooking:

Or flower arrangements:

Or flower arrangements:
Except unlike electronics, the effects of physical deterioration (surrounds,etc.) and/or abuse with vintage transducers add another variable with them. Start with 'new' to gain experience? Vintage 'later'?
I actually think this might be needed. For example I have Polk monitor 7b's. Everyone swears by the peerless tweeter. Would be fun to measure it with each of the optional newer tweeters including the brand new tweeter you can get from Polk that's still compatible.
Or how about one measurement before and after a recone, or surround replacement, or crossover maintenance to see how much these things effect the sound instead of the unverified myths we just accept now.
The possibilities seem endless with Amir's time being the only limiting factor.
How effective is bi-amping? Redisigning the crossover, adding dampening to the cabinet or bracing?
Think of what myths we can bust and or truths Amir can quantify and qualify.
Covered a lot in the spinorama, but:Figuring out what useful data is and is not is a major challenge. I don't want to post a ton of graphs just for the sake of it.
• Sensitivity / Impedance / Phase
• On-axis
• Usually tweeter access, but read manual or look at vertical performance; one pet peeve with Stereophile is J.A. will state the reference axis is below tweeter level, but will have tweeter level as on-axis, making performance seem poor (example).
• Listening window (debatable on angles; usually +/-15° H with +/-5° V)• H/V off-axis plot; I prefer both an off-set 3D view (Stereophile) as well as 2D (Audioholics)
• Usually referenced to on-axis, but if on-axis is sacrificed for overall sound (Gedees), show non-referenced, Stereophile sometimes does this.
• As for angles, +/-90°?
• H/V polar plots; less telling version of off-axis plots, but are easier to read.• THD (maybe @ 95dB @ 1m, but 105dB is reference level peaks, but not all speakers can handle this, the NRC does 96dB and 101dB if the speaker can handle it).
• CSD/Waterfall (normalized)
• Predicted In-Room Response
• Cabinet resonances (can be indirectly seen in FR measurements, but a direct test like Stereophile’s would be appreciated).
• Linearity (compression), usually not a big deal, but should be run and shown if not great, NRC does 76dB vs 96dB and goes louder if the speaker can handle it.
• Max SPL @ given THD, Neumann shows this for their speakers (1%, with 10% for bass), not a necessary graph.
_________________________________________________________________
Measurement site comparisons:
KEF LS50: Stereophile vs NRC
Revel M126Be: Audioholics vs NRC
Neumann KH80: Sound & Recording (German)
Last edited:
Newk Yuler
Active Member
- Joined
- Mar 5, 2019
- Messages
- 155
- Likes
- 252
It's extraordinarily gratifying to be reassured Amir is spot on his game. ASR is awesome and as always, greatly appreciated.
If there is a way to measure IMD for speakers, I would like to see it.
Also compression.
And phase response.
Cabinett resonances.
Some speakers are designed to be placed close to wall, or on wall. Can you measure that way?
Also compression.
And phase response.
Cabinett resonances.
Some speakers are designed to be placed close to wall, or on wall. Can you measure that way?
OP
- Thread Starter
- #60
There is but I am not sure if I have that option. I can measure and separate different harmonics.If there is a way to measure IMD for speakers, I would like to see it.
Yes, in every way you may possibly want.And phase response.
This requires more expense. I have the laser interface but not the laser module. Could do it on the cheap the way stereophile does it. Alternatively such resonances usually show up in other measurements so we could go by those.Cabinett resonaces.
Similar threads
- Replies
- 331
- Views
- 43K
- Replies
- 154
- Views
- 22K
- Replies
- 7
- Views
- 586
- Poll
- Replies
- 65
- Views
- 13K
- Poll
- Replies
- 333
- Views
- 53K