• WANTED: Happy members who like to discuss audio and other topics related to our interest. Desire to learn and share knowledge of science required. There are many reviews of audio hardware and expert members to help answer your questions. Click here to have your audio equipment measured for free!

A More Useful Way of Measuring the Performance of DACs?

Status
Not open for further replies.

Mr. Widget

Major Contributor
Forum Donor
Joined
Oct 11, 2022
Messages
1,174
Likes
1,772
Location
SF Bay Area
But here's something I find interesting...

When the RMS levels of the 3 captures are matched to within 0.001dB, their peak levels differ by 0.1-0.2dB. This must be down to the different dynamic behaviour of the 3 DACs... something that is not revealed in any of the tests currently conducted here on ASR, or elsewhere, that I can tell.
You bring up many interesting points. I thank you for sharing this!

I hope we discover more testing methodologies that might better mimic our auditory perception. Engineering excellence is wonderful, in and of itself, but at the end of the day I would rather listen to music.
 

j_j

Major Contributor
Audio Luminary
Technical Expert
Joined
Oct 10, 2017
Messages
2,279
Likes
4,786
Location
My kitchen or my listening room.
It would be interesting to determine if there is in fact a correlation between the two. Maybe @j_j could help?
It has to be anti-imaging filter response, as long as the power spectra match completely, or perhaps different frequency response, but that generally goes right back to anti-imaging filter.

That is, assuming other things in the test were done properly. Any shift in frequency response could have that effect, as could different bass responses due to cheap DC blocking capacitor in the DAC circuit, come to think of it.
But exactly what is annoyingly hard to determine. Maybe do an impulse response measurement of all 3?
 

restorer-john

Grand Contributor
Joined
Mar 1, 2018
Messages
12,678
Likes
38,771
Location
Gold Coast, Queensland, Australia
The output impedance of each D/A is an unknown, as is the input impedance of the ADC. Not saying it is the cause, but D/As vary from 0R to several kR.
 

solderdude

Grand Contributor
Joined
Jul 21, 2018
Messages
15,999
Likes
36,215
Location
The Neitherlands
Output R Scarletti = 3ohm
ADI 2 = 100/200ohm (SE/balanced)
Okto = 200ohm

No differences can come from there.

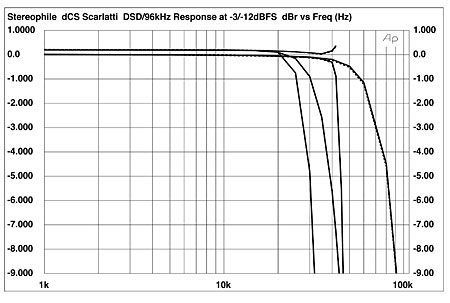
FR of DCS Scarlatti: (assuming this is the one)
809DCSfig01.jpg

differences won't be coming from there either.

The differences also won't be explained with SINAD.

DCS (2009) measures great and competes with today's better DACs

Anyone analyzed/listened to the posted files ?
 
Last edited:

amirm

Founder/Admin
Staff Member
CFO (Chief Fun Officer)
Joined
Feb 13, 2016
Messages
44,595
Likes
239,595
Location
Seattle Area
I went to a lot of trouble to do blind ABX a few years ago. It took 18 minutes to conduct. Scored 9/10 (got #9 wrong). Still wasn't believed that I was hearing what I was. So... never again.
9 out 10 wrong is very much statistically significant! It would happen for example if you guessed correctly 9 out of 10 times but mistook the ABX tool controls. In other words, you voted A when you should have hit B. If so, you generated reliable evidence that you heard a difference. The prudent thing would have been to check everything and try again.
 

voodooless

Grand Contributor
Forum Donor
Joined
Jun 16, 2020
Messages
10,371
Likes
18,281
Location
Netherlands
So what about inter-sample-overs? They could easily explain the differences in RMS level even after level matching.

Also, the test conditions of your ABX test, and your null test were not the same. The ABX was level matched in Roon. If you lower the gain of one of the two DAC’s, it will have different clipping behavior. For a fair comparison, you’ll to lower the gain by 1 or 2 dB for all sources to begin with. I’d do the same for the null test.

Any idea how much gain compensation the null test did? Since we’re talking of so small differences, this might already be a significant . Probably better to do the level matching in the analog domain.

As for the audibility of any of this.. doubtful. Didn’t have a chance yet to listen to the files, but will try later.

And are you fairly young? The dCS looks to drop off a tad earlier than the other two, possibly that may be audible with bat-ears ;).

Also probably a good idea to link the thread about your ABX test, as far as I can remember, there is one? That may save a lot of rehashing of the subject.
 

voodooless

Grand Contributor
Forum Donor
Joined
Jun 16, 2020
Messages
10,371
Likes
18,281
Location
Netherlands
What people seem to be missing is the PK Metric really is the gold standard for audibility and perception.
Based on what? Your very small sample? To make any conclusions either way, this needs a whole lot more testing.
I agree with you, having done way too many pointless ABX tests- they are no fun
They are not supposed to be fun. They are a scientific instrument to remove bias.
and prove nothing to anyone but yourself
Because in general, people either give up or stop as soon as they have the desired result. “9 out of 10 once is good enough, convinced, period!” What is so hard in doing it 3 more times and getting a few more 9 out of 10s? It took him 20 minutes, a lot less than doing all this recording, analyzing and typing a post. Now with these sample files, it’s even more trivial.
and even then, they really don't help with preferences.
They are not about preference. Your not opening a can with a spoon either, are you? Although, apparently you can:


:facepalm:;)
 
Last edited:

LTig

Master Contributor
Forum Donor
Joined
Feb 27, 2019
Messages
5,814
Likes
9,530
Location
Europe
the RMS levels of the 3 captures are matched to within 0.001dB, their peak levels differ by 0.1-0.2dB. This must be down to the different dynamic behaviour of the 3 DACs... something that is not revealed in any of the tests currently conducted here on ASR, or elsewhere, that I can tell.
As @voodooless said it could be due to intersample overs. Upsample each track by a factor of 4 and then remeasure RMS and peaks.
 

gvl

Major Contributor
Joined
Mar 16, 2018
Messages
3,469
Likes
4,064
Location
SoCal
Humour me. Take a listen to the 3 files I linked. One should sound 'duller' than the other two. That's the dCS. The other two sound similar.

That's what I'm hearing with the captures. It's more pronounced listening directly to the outputs of the DACs (level-matched, blah, blah, blah).

Admittedly I can't hear above 15kHz, but these captures sound much the same to me through RME ADI-2 DAC/Sundara. I cannot sense any "dullness" anywhere.
 

Blumlein 88

Grand Contributor
Forum Donor
Joined
Feb 23, 2016
Messages
20,696
Likes
37,432
I think it might be a little FR difference making them audible.

Here is file A vs B. 1st linear and then log graphing. A is the reference file.

I doubt if this is audible on response, but that ultrasonic peak is well over 10 db. I am not clear on which DAC and ADC pairings were on the three files available. Possible aliasing or imaging is making a difference, but with such deep nulls it seems unlikely.
1669186543306.png


1669186651039.png


Now A vs C. I have an ADC that does this kind of rippled response. It seems borderline at best that it would be audible. But we have a ripple even down to below 3 khz and a slight droop above 10 khz. I've been able to discern this with Foobar ABX in the past (I haven't tried it on these files). Also this isn't the kind of thing where I listen to a couple songs and hear differences. I find some portions where I can hear a difference in 5 seconds of music with rapid switching. If I use 30 second segments I can hear no difference beyond chance.

1669187324078.png


1669187081707.png


Now B vs. C. The ripple is probably in C from what we've seen earlier. That might make A and B audible vs C. It also appears the ultrasonic difference is in B.

1669187673141.png


1669187770083.png


So I don't know if these ripples and ultrasonic issues make an audible difference. Here is A vs C with Frequency and Phase EQ engaged in Deltawave. I thought I remember being able to export the corrected audio file, but don't see it right now. Maybe @pkane could show us if I've simply forgotten how, and maybe @manisandher could correct all files for phase and FR then see if they still sound different.
1669189512092.png


1669189429506.png


1669189622436.png
 
OP
manisandher

manisandher

Addicted to Fun and Learning
Joined
Nov 6, 2016
Messages
656
Likes
612
Location
Royal Leamington Spa, UK
Also the level matching methodology was not shared.

1. set DAC vol control to 0dB
2. set ADC input sensitivity (+13dBu for RME, +12dBu for Prism)
2. play 1kHz 0dB sine through Roon
3. adjust Roon's 64-bit DSP so that levels captured with the ADC match

Here are the resulting levels (RME ADC):

DAC A - 1kHz 0dB into +13dBu.JPG
DAC B - 1kHz 0dB into +13dBu.JPG
DAC C - 1kHz 0dB into +13dBu.JPG

The neither the DACs nor the ADC were anywhere near clipping. These levels were then maintained throughout.

Mani.
 
OP
manisandher

manisandher

Addicted to Fun and Learning
Joined
Nov 6, 2016
Messages
656
Likes
612
Location
Royal Leamington Spa, UK
If I was the OP I think I would just enjoy my gear and be happy and not try to sway the opinion of folks who are unlikely to change their mind, YMMV.

I'm certainly very happy with my RME and Okto - they are both phenomenal pieces of kit.

The jury's still out on the dCS - it sounds 'boring' in comparison. But its PK Metric suggests that it's actually the most audibly and perceptually accurate. I find this fascinating.

Mani.
 

restorer-john

Grand Contributor
Joined
Mar 1, 2018
Messages
12,678
Likes
38,771
Location
Gold Coast, Queensland, Australia
They are not about preference.

In the context we are discussing, they absolutely are about preference. Most of the noisy ASR congregation have never actually bothered with ABX testing of anything- they just yell 'ABX!' from the side-lines. It's pathetic, boorish and achieves nothing except make this place look even more fringe, out of touch and full of bat-chit crazy nutcases.

And even if they did bother, what are they actually attempting to achieve in the first place? Mostly, they go in with a pre-set agenda. They want to hear no difference, because then they can justify their cheap-ass purchases of poorly made gear that fails prematurely. That is the bottom line.

Which brand gets the most air-time on ASR? Topping. Why? Because it kinda tests OK, is cheap, and a noisy bunch of people with clearly limited budgets tell them to buy it to be part of the club. Yawn.

And, which is the ONLY brand with thread after thread of problems, issues, failures, dissatisfaction and burnt customers? Topping again.

Buying and owning HiFi equipment is always about preference. It has never been anything else. ABX is just about whether you can perceive a difference, not which one, two or ten products you prefer over others. It's not the gold standard for selecting HiFi components. Never was and never will be. If it was, there would have been ABX comparators in every HiFi store. But there were comparators in every proper HiFi store because it was easy to hear differences between amplifiers, receivers, tuners, turntables and particularly speakers. Then customers could buy based on their actual preferences. After all, that what is was all about.

There is no testing of product synergies and anyone with a speck of understanding knows that is a grossly overlooked. That is, the interactions between components and resulting overall system performance. Think: end to end SINAD, FR etc. Whenever I've ABX'd some cheap Chinese amplifiers with quality vintage gear, the cheap stuff gives themselves away very quickly due to noises, clicks, pops, imbalances, etc. The amount of effort required to remove the 'tells' means they aren't ready. A friend wanted me to blind compare his Topping DAC to my classic vintage TOTL CD player recently and the balance of the Topping DAC was so different, it was a waste of time. That stuff is basic, and yet they can't get it right.

I choose preference. That encompasses, features, measured performance, build quality, reliability, functionality and plain good engineering.
 
OP
manisandher

manisandher

Addicted to Fun and Learning
Joined
Nov 6, 2016
Messages
656
Likes
612
Location
Royal Leamington Spa, UK
OP
manisandher

manisandher

Addicted to Fun and Learning
Joined
Nov 6, 2016
Messages
656
Likes
612
Location
Royal Leamington Spa, UK

voodooless

Grand Contributor
Forum Donor
Joined
Jun 16, 2020
Messages
10,371
Likes
18,281
Location
Netherlands
Last edited:

Blumlein 88

Grand Contributor
Forum Donor
Joined
Feb 23, 2016
Messages
20,696
Likes
37,432
The PKmetric hasn't been rigorously tested for mimicking hearing audibility levels. OTOH, it is based upon ideas that are well investigated. Whether it is just right or not it is in my opinion considering what it is made of and how it works like A-wtd. A step in the right direction, likely a much bigger step than A-wtd, and likely a good step toward matching reality. A-wtd scales are based upon the very simple idea of how our hearing has higher thresholds at very high and very low frequencies. PKmetric incorporates that and more like using ERB bands. Seems a really good bet it is better than nothing and better than A weighting. I've played around with it adding things to the comparison file, seeing how it effects the metric reading vs when I hear it easily. One easy example being 60 hz hum levels.

A and the now rarely used B weighting didn't have much more than this behind it initially. Subsequent experience using it in the field for determining noise levels that cause hearing damage indicated it was at least useful though not perfect.

I think Paul has the opinion that PK metric levels of less than -70 db should be inaudible.
 

voodooless

Grand Contributor
Forum Donor
Joined
Jun 16, 2020
Messages
10,371
Likes
18,281
Location
Netherlands
1. set DAC vol control to 0dB
2. set ADC input sensitivity (+13dBu for RME, +12dBu for Prism)
2. play 1kHz 0dB sine through Roon
3. adjust Roon's 64-bit DSP so that levels captured with the ADC match

Here are the resulting levels (RME ADC):

View attachment 245496
View attachment 245497
View attachment 245498

The neither the DACs nor the ADC were anywhere near clipping. These levels were then maintained throughout.

Mani.
Thanks for sharing. What were the gains that you entered in Roon for the three DAC's?
 
OP
manisandher

manisandher

Addicted to Fun and Learning
Joined
Nov 6, 2016
Messages
656
Likes
612
Location
Royal Leamington Spa, UK
So I don't know if these ripples and ultrasonic issues make an audible difference.

Thanks for the effort. But both of these effects are easily explained.

1. The ultrasonic 'issues' are down to the different anti-imaging filters in the respective DACs. Although I selected the steepest/fastest filters, they still have different characteristics, as shown in the FR plots of the DK track I posted here: https://www.audiosciencereview.com/...ng-the-performance-of-dacs.39379/post-1387863

2. The ripples >1kHz are due to the RME ADC's DC blocking capacitor. They should be identical for all 3 captures, but perhaps the DAC/ADC interactions cause slightly different behaviours? In any event, I can redo the captures/measurements without the DC blocker engaged.
 
OP
manisandher

manisandher

Addicted to Fun and Learning
Joined
Nov 6, 2016
Messages
656
Likes
612
Location
Royal Leamington Spa, UK
That's circular reasoning at best...

From the link:

"PK Metric is computed in the frequency domain over multiple, overlapping time windows of 400ms each. For each 400ms time window an STFT (Short-Time Fourier Transform) is performed for both, the reference and the comparison. The spectra of the two windows is corrected using equal loudness curves. This step uses an interpolated version of ISO 226:2003 curves and is designed to adjust the frequency weights according to their audibility at the current playback level. The level is estimated from the sound energy computed for each of the two windows being compared. For example, a 20kHz frequency will be weighted a whole lot less than 3kHz. The adjusted frequency responses are then reduced using an ERB (Equivalent Rectangular Bandwidth) smoothing filter, and finally, each of the ERB buckets in the comparison is subtracted from the same ERB bucket in the reference. The energy of the resulting error spectrum is then summed to produce a single dB value representing how loud the error is at that particular 400ms interval."

Where's the 'circular reasoning'?
 
Status
Not open for further replies.
Top Bottom