• WANTED: Happy members who like to discuss audio and other topics related to our interest. Desire to learn and share knowledge of science required. There are many reviews of audio hardware and expert members to help answer your questions. Click here to have your audio equipment measured for free!

PMA-NC252MP power amplifier

OP
pma

pma

Major Contributor
Joined
Feb 23, 2019
Messages
4,602
Likes
10,768
Location
Prague
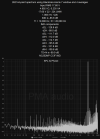
High power spectrum measured with high dynamic range of the measurement. Though SINAD here is 101.1dB and THD is well below 0.001%, the spectrum is not clean. It has a lot of residuals of SMPS operation. Also please note the rise of noise floor and distortion components above 22kHz, this is the reason of worse THD+N results when measured with higher BW than 22kHz. I think it is fair to mention these facts.

NC252MP_E1DA_141W_4R_1k.png
 

Davide

Senior Member
Joined
Jul 6, 2020
Messages
465
Likes
175
Location
Milan, Italy
Seeing these very interesting measures makes me wonder if there are more valid amplifiers in terms of price / performance ratio. Unfortunately, there are no such comprehensive analyzes on the web ...
 
OP
pma

pma

Major Contributor
Joined
Feb 23, 2019
Messages
4,602
Likes
10,768
Location
Prague
Seeing these very interesting measures makes me wonder if there are more valid amplifiers in terms of price / performance ratio. Unfortunately, there are no such comprehensive analyzes on the web ...
Hello, thank you, you are right that there are not so many deep analyses in the web, but hopefully @amirm makes a lot of useful reviews and measurements where we can see almost same results. Maybe not the same plots, however we can decipher it from his posted measurements.

Re SMPS mains residuals and not perfectly clean spectra of NC122MP, NC252MP or NC502MP modules, we can see almost same or very similar results here in


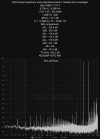
As a comparison, the 5W/4ohm/1kHz as I measured - we can see same THD+N (aka SINAD)

NC252MP_E1DA_5W_4R_1k.png


As for high frequency non-linearity of the mentioned modules, it is shown in Amir's measurements like these


Regardless these imperfections, the price/performance ratio of those NCXYZMP modules remains excellent. Mains related residuals are because of the close proximity of SMPS and amplifier circuits on the same PCB board, high frequency non-linearity is a result of feedback loop transfer function. Improvements are possible with separated SMPS supplies and even more sophisticated feedback loop as in Purifi 1ET400, however you have to pay much more money then.
 

Davide

Senior Member
Joined
Jul 6, 2020
Messages
465
Likes
175
Location
Milan, Italy
Yes, there are a lot of amps measured here, but not extensively, and also not related to the price. We have the SINAD per dollar ratio but is a bit useless to me and can lead to wrong conclusions (see Topping LA90).
As far as I'm concerned, and for what little I understand, I think nCore is a perfect combination of engineering and market.
Purifi 1ET400A is already meaningless in my opinion, at least for a private user (with a normal income) and probably gives no audible differences, also because objectively it doesn't seem much better as THD vs frequency (Bench AHB2 for example I consider it a significant step).
To the detriment of the nCore, however, there is product complexity and heat management, and consequently reliability and repairability. I sincerely hope mine will last 30 years at least, but today it seems a bit absurd to believe it...
The point of high efficiency and low heat is completely out of place. The efficiency, at the power levels normally used, does not differ much from the best class AB and linear power supplies, and heat due to loss are as far as 180 W full load (NC502MP), at least from what the numbers say, which for such a small device means it runs hot!
In fact, I built my nCores with heatsinks and fans, as well as thermal paste and new thermal pads, hoping they will last longer.
It is for all this that, as a man with a mediocre salary that I am, I wonder if there are better amplifiers in terms of cost, power, performance and reliability.
But unfortunately, there is not such an extensive comparison on products.
I with my analyzes, and despite what has just been said, I could not find better than the NCXXXMP modules... but I would like something equally powerful in the AB class.
 
Last edited:
OP
pma

pma

Major Contributor
Joined
Feb 23, 2019
Messages
4,602
Likes
10,768
Location
Prague
IMD measurements of the PMA-NC252MP amplifier

I am rather interested in deep verification of the amplifiers than in a fast overview. To continue in this effort, I have decided to perform a set of intermodulation and multitone measurements. My relatively new system test combo, Topping D10s + E1DA Cosmos ADC, allow me to set quite accurate distortion measurements of power amplifiers.

The new images with plots are provided with quite detailed legend and are quite big, so this time I have decided to post thumbnails, so please click on the to see the full images. Both plots of the measuring system distortions and amplifier measurements are shown in some cases, to see where is the measurement limit.

Measurements of intermodulation distortions

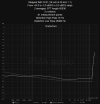
Let me start with definitions, which I have borrowed from the REW manual, as the REW is the software used for the measurements. The definitions explain why you would see apparently different maximum power corners at the X-axis of the plots.

The CCIF (19+20kHz) figure is calculated from the level at f2 - f1 (also called the 2nd order Difference Frequency Distortion or DFD2). The 3rd order DFD3 figure based on the levels at 2*f1 - f2 (18 kHz) and 2*f2 - f1 (21 kHz) is also shown. The reference level for the DFD figures is the sum of the level at f1 and the level at f2. An IMD pwr figure is also shown, which is the ratio of the rms sums of the IMD components to the rms sum of f1, f2 and the IMD components.

The TDFD IMD DFD is calculated from the rms sum of 2nd order and 3rd order components, the reference level for the percentage figure is the sum of the levels at f1 and f2. For TDFD Phono (3005+4662Hz) and TDFD akl (13586+19841Hz) d2L (f2 - f1) and d3L (2*f1 - f2) are used, for TDFD Bass (41+89Hz) d2H (f2 + f1) and d3H (2*f2 - f1) are used.

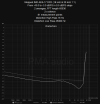
The AES17 DFD IMD (18+20kHz) figure is based on the levels at f2 - f1 (2 kHz), 2*f1 - f2 (16 kHz) and 2*f2 - f1 (22 kHz), the reference level for the IMD AES percentage figure is the level at f1 (18 kHz). In all cases levels are measured across a 500 Hz bandwidth centered on the component being measured, per the AES17-2015 specification. DFD2 and DFD3 are also shown.

In all cases REW also shows a total distortion + noise percentage, TD+N. This figure is the square root of the ratio of the noise and distortion powers to the power of the tones.

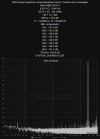
Let's start with the CCIF IMD (19+20kHz)

Measuring system CCIF IMD; Amplifier CCIF IMD at 17.6V/4ohm
NC252MP_E1DA_CCIF_systemloop.png NC252MP_E1DA_CCIF.png
IMD = -118dB, TD+N = -105.8dB; IMD = -85.8dB, TD+N = -99.9dB


CCIF IMD distortion vs. output power
NC252MP_E1DA_19+20k_power.png


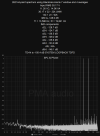
Now the TDFD akl IMD (13586+19841Hz)

Measuring system TDFD IMD; Amplifier TDFD IMD at 17.91V/4ohm
NC252MP_E1DA_TDFD_systemloop.png NC252MP_E1DA_TDFD.png
IMD = -128dB, TD+N = -105.4dB; IMD = -112.1dB, TD+N = -100.2dB


Now AES17 (18+20kHz) distortion vs. power. Please remember that in this case the power is referred only to the 18kHz component, by definition.
NC252MP_E1DA_18+20k_power.png


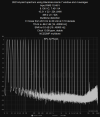
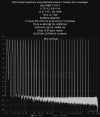
Multitone measurements (please note that the LF spectrum resolution is related to the window used)

Measuring system multitone; Amplifier multitone
NC252MP_E1DA_multi_systemloop.png NC252MP_E1DA_multi.png
TD+N = -96.9dB; TD+N = -86.2dB


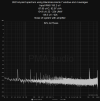
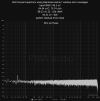
The last set shows the residual system noise error and the system+amplifier noise. The residual system nosise is measured in the complete loop, but the input wires of the measuring cable are shorted and connected to the amplifier output Lo terminal (= Com speaker terminal)

System residual error noise; Amplifier output noise, in the system used
NC252MP_E1DA_noise_systemloop.png NC252MP_E1DA_noise_amploop.png
 
Last edited:
OP
pma

pma

Major Contributor
Joined
Feb 23, 2019
Messages
4,602
Likes
10,768
Location
Prague

EJ3

Major Contributor
Forum Donor
Joined
Dec 10, 2019
Messages
2,183
Likes
1,702
Location
James Island, SC
This review has already been mentioned here. It is very nice, however He measured a different set of measurements, and I am also interested in some different ones.
The two that I feel MOST important that are not done on this site are:

Dampening Factor

Slew Rate

And as seen in the review you mentioned, they both come up, one with the graph
and the other in the text.

For a few years manufacturers of amps gave these 2 specs (the NAD 2100's & 2200's that I have has Dampening Factor in their specs).
I guess it was lobbied by the manufacturers to not do these 2, I don't know.
 

Rick Sykora

Major Contributor
Forum Donor
Joined
Jan 14, 2020
Messages
3,593
Likes
7,263
Location
Stow, Ohio USA
This review has already been mentioned here. It is very nice, however He measured a different set of measurements, and I am also interested in some different ones.

Also like that you are concise. A little too much musing for me means it gets the tldr from me…

Would be useful to understand how your measurement equipment chains compare though. If you are willing, please share when convenient. Thanks!
 
OP
pma

pma

Major Contributor
Joined
Feb 23, 2019
Messages
4,602
Likes
10,768
Location
Prague
Also like that you are concise. A little too much musing for me means it gets the tldr from me…

Would be useful to understand how your measurement equipment chains compare though. If you are willing, please share when convenient. Thanks!
The limits of my distortion measurements are shown in this thread:

 
OP
pma

pma

Major Contributor
Joined
Feb 23, 2019
Messages
4,602
Likes
10,768
Location
Prague
This is a set of measurements of THD vs. frequency at various output power and 4ohm load. Please note that with increasing power the distortion remains fine for the middle frequencies, but rises at both ends of the audio band. Measuring bandwidth was 24kHz.
PMA-NC252MP thdfreq multiwatt-labeled.png
 

SIY

Grand Contributor
Technical Expert
Joined
Apr 6, 2018
Messages
10,478
Likes
25,216
Location
Alfred, NY
This is a set of measurements of THD vs. frequency at various output power and 4ohm load. Please note that with increasing power the distortion remains fine for the middle frequencies, but rises at both ends of the audio band. Measuring bandwidth was 24kHz.View attachment 250423
Is the reference voltage for each measurement different, i.e., normalized for that particular power level?
 

Sokel

Master Contributor
Joined
Sep 8, 2021
Messages
6,013
Likes
6,012
This is a set of measurements of THD vs. frequency at various output power and 4ohm load. Please note that with increasing power the distortion remains fine for the middle frequencies, but rises at both ends of the audio band. Measuring bandwidth was 24kHz.View attachment 250423
That's a really interesting one.
 

lashto

Major Contributor
Forum Donor
Joined
Mar 8, 2019
Messages
1,045
Likes
535
This is a set of measurements of THD vs. frequency at various output power and 4ohm load. Please note that with increasing power the distortion remains fine for the middle frequencies, but rises at both ends of the audio band. Measuring bandwidth was 24kHz.View attachment 250423
should still be in non-audible territory but the spike between 5-8kHz is quite worrisome. Supposedly that is the sibilant range

@Archimago also has lots of measurements for the NC252 module and they look similar to yours. Unfortunately his THDvs.freq graphs stop at 100W. IIRC that was his personal device, maybe you can ask him to remeasure & see if he gets the same results
 

Matias

Master Contributor
Forum Donor
Joined
Jan 1, 2019
Messages
5,063
Likes
10,895
Location
São Paulo, Brazil
Nice. Shows that when it starts to distort beyond its knee, the bass goes out first.
 

mdsimon2

Major Contributor
Forum Donor
Joined
Oct 20, 2020
Messages
2,508
Likes
3,353
Location
Detroit, MI
Thanks for sharing.

Not necessarily surprising given we already have THD+N measurements as a function of power for various frequencies (obviously Amir used 45 kHz bandwidth instead of 24 kHz) which show the high and low frequencies giving out first, but the log scale makes the difference less obvious at first glance.

I think I like @pma's representation more but I certainly won't complain about having both.

1671198822689.png


Michael
 
  • Like
Reactions: pma

Sokel

Master Contributor
Joined
Sep 8, 2021
Messages
6,013
Likes
6,012
Nice. Shows that when it starts to distort beyond its knee, the bass goes out first.
I wouldn't worry about the bass,but of that near 80db at 6-7Khz where our perception is strong...

Edit:Now I finally have a hint of the elevated acoustic distortion in very lows I have posted when swapping between 1200as2 and 300a2.
 

Matias

Master Contributor
Forum Donor
Joined
Jan 1, 2019
Messages
5,063
Likes
10,895
Location
São Paulo, Brazil
I would worry about the bass,but of that near 80db at 6-7Khz where our perception is strong...
You are absolutely right. This is sibilance region. So with high volume the S's start to sound "aggressive". Yet another reason to favor the NC502MP and have more power in reserve for not much $ more.
 
Last edited:

lashto

Major Contributor
Forum Donor
Joined
Mar 8, 2019
Messages
1,045
Likes
535
I think I like @pma's representation more but I certainly won't complain about having both.
Big fan of archimago's way to show HD vs freq, would be great to have such graphs for all devices. His power choices at 1w/25W/100W seem ok to me, I would just add another one at max power (i.e. the 0.1% THD level).
3-4 extra graphs might be quite a bit of work though...
 
Top Bottom